Publications

Comparing Recent Health Care Proposals: From building on the ACA to Medicare for All

Yellow road sign reading "Health insurance changes ahead", referring to the changes to the Healthy Michigan Plan.

A yellow road sign reading, "Health insurance changes ahead," indicating changes due to the health care proposals the author is comparing.Democratic lawmakers in Congress have made a variety of proposals to strengthen or reform the United States health care system. These proposals range from building upon the Affordable Care Act (ACA) to fully transitioning the U.S. to a single-payer system. This fact sheet categorizes and compares the major provisions of these proposals, including possible implications for consumers, health care providers, and federal and state governments.

The proposals that the fact sheet compares are: ACA 2.0, which increases Marketplace financial assistance, restores outreach and assistance funding, and creates a reinsurance program; Public Option, which creates a publicly-administered health insurance plan offered for purchase on the Marketplace; Medicaid Buy-In, which provides certain individuals with the opportunity to purchase Medicaid coverage; Medicare Buy-In, which provides certain individuals with the opportunity to purchase Medicare coverage; Medicare for America, which provides an option and incentives for all US citizens to switch to Medicare coverage; and Medicare for All, which replaces the current health insurance system with universal Medicare coverage for all U.S. citizens.

For each health care proposal, the sheet considers who would be affected, what would be covered, what cost-sharing would look like, how it would impact other types of coverage, how it could impact health care providers, how it would be financed, and how much it could cost. The fact sheet also lists the specific bills and proposals for each health care option.

This fact sheet combines information on all the recent health care proposals in a straightforward, objective format so the proposals can easily be compared and considered. 

READ THE REPORT

Michigan Physician Survey: Primary care physician perspectives and practice trends

A physician, such as the physicians surveyed in Michigan for this research, sits across from a male patient in dark clothes.CHRT has been surveying primary care physicians (PCPs) in Michigan since 2012—tracking key trends in practice patterns, capacity, payer mix and care team composition. Our 2019 Michigan Physician Survey also asked physicians about care continuity and Medicaid work requirements legislation.

PCPs are a key component of a successful, high quality healthcare system. As the baby-boomer generation ages and the needs of this cohort increase, there is ongoing concern about how well the health care workforce can meet the increasing demands of an older and presumably sicker population.

Additionally, primary care is on the front lines of improving care delivery, such as increasing care management for complex cases, integration of behavioral health care and identifying and addressing social determinants of health.

Key findings of our 2019 Michigan Physician Survey include:

  • Primary care capacity in Michigan is good today, but there is some evidence it may decrease in the future. Capacity to accept new patients is high and has increased across all payer types since 2016. Almost two-thirds (62%) of PCPs indicated capacity for new Medicaid patients and over 80 percent reported capacity for Medicare and privately insured patients. However, 45% of PCPs indicate they intend to stop practicing medicine within the next 10 years— raising important questions about new PCPs or other practitioners in the training pipeline, and the need to continue tracking capacity over the next decade.
  • PCPs report more multi-disciplinary care team members than in 2016. Practices with a relatively higher volume of Medicaid patients were almost twice as likely to have Community Health Workers (CHW) and co-located psychiatrists on the care team. And, for the most part, hospitals and groups practices were more likely to have support staff, such as care managers and nurse practitioners, than single physician practices.
  • High deductibles and other cost issues threaten continuity of care. PCPs see cost and insurance-related issues as the biggest barriers to maintaining continuity of care with their patients; along with lack of transportation and limited health literacy.
  • The majority of PCPs are concerned about the impact Medicaid work requirements may have on care continuity and the complexity of the certification process. They are more evenly split in their opinions about how the new Medicaid work requirements could change the number of Medicaid patients in their practices, whether they would need to hire more staff, and the ethical issues of determining if someone is able-bodied.

READ THE REPORT

Cover Michigan Survey: Use of Health Care Benefits in Michigan

Data from the Center for Health and Research Transformation’s (CHRT) 2018 Cover Michigan Survey show health benefits that Michiganders with health insurance coverage have used in the past year (1)Survey participants were asked whether or not they or other family members covered by their plans used each health care benefit in the past 12 months.. Detail on the Cover Michigan Survey and analysis methodology can be found on CHRT’s website. In addition to findings on overall use of health care benefits, this brief focuses on three key areas: dental and vision, reproductive health, and mental health care.

Nearly all Michiganders used some kind of health benefit over the last year. To understand differences in the use of health care benefits, several variables were examined by demographics including gender, age, race, insurance type, income, and employment status.

  • Preventive care: The highest utilized benefit was routine, preventive primary care This was consistent across all groups.
  • Dental and vision care: There is high use of these benefits even though they are not generally core offerings of most insurance
  • Reproductive health care: Michigan women, especially younger women, use these health benefits at a significantly higher rate than men and older women. Reproductive health care represents 11 percent of younger women’s health care utilization.
  • Mental health care: Younger women and people who are unemployed reported significantly higher use of their mental health care or substance use treatment coverage.

Other findings include:

  • Aside from dental and inpatient care, women consistently utilized more health care benefits than men.
  • African Americans were the least likely to visit a doctor and use vision care benefits compared to other races, while white Michiganders were the most likely to use inpatient services.
  • Regardless of insurance type, respondents use doctor visits at similar rates, however those with employer-provided insurance were the most likely to use dental care health benefits.
  • Medicaid beneficiaries had the highest utilization of pediatric care, contraceptive/family planning, mental health/substance use, and maternity/newborn care benefits; and Medicare beneficiaries made the most use of the prescription drug benefit. These differences are likely due to the unique populations that make up membership in these plans.
  • Compared to those with lower household income, Michiganders with incomes of $50,000 or more per year were far more likely to use dental care, doctor visits, and vision benefits.
  • The unemployed population was more likely to use inpatient care, mental health/substance abuse services, and maternity/newborn care than those who are working or in school.

READ THE REPORT

References

References
1 Survey participants were asked whether or not they or other family members covered by their plans used each health care benefit in the past 12 months.

Flu Vaccination in Michigan: Opportunities for Improvement

Person receiving a flu vaccination.Introduction

Approximately 6,000 Americans die of influenza every year,(1)Centers for Disease Control and Prevention, “Estimates of Deaths Associated with Seasonal Influenza — United States, 1976–2007,” Morbidity and Mortality Weekly Report (MMWR), Aug. 27, 2010, 59(33): 1057–62: http://www.cdc.gov/mmwr/preview/mmwrhtml/mm5933a1.htm (accessed 6/25/15) and almost 800 people were hospitalized during the 2014–2015 flu season in the four Michigan counties that report flu hospitalizations (Clinton, Eaton, Genesee, and Ingham counties).(2)Michigan Department of Health & Human Services, “Influenza Surveillance Report for the Week Ending June 13, 2015,” MI Flu Focus, Influenza Surveillance Updates, (Lansing, MI: Michigan Department of Health & Human Services, Bureaus of Epidemiology and Laboratories, June 24, 2015), 12(23): http://www.michigan.gov/documents/mdch/MIFF_6-24-15_492747_7.pdf (accessed 6/25/15). Although the Centers for Disease Control and Prevention (CDC) Advisory Committee on Immunization Practices recommends that all adults and children over the age of six months receive an annual flu vaccination,(3)Centers for Disease Control and Prevention, Advisory Committee on Immunization Practices (ACIP) Reaffirms Recommendation for Annual Influenza Vaccination (Atlanta, GA: CDC, Feb. 26, 2015): http://www.cdc.gov/media/releases/2015/s0226-acip.html (accessed 6/25/15). only 42 percent of American adults were vaccinated against the flu during the 2013–2014 flu season.(4)Centers for Disease Control and Prevention, Flu Vaccination Coverage, United States, 2013–14 Influenza Season (Atlanta, GA: CDC, September 14, 2014): http://www.cdc.gov/flu/fluvaxview/coverage-1314estimates.htm (accessed 9/1/15). Michigan’s vaccination rate during the 2013–2014 flu season was slightly lower than the national average at 40 percent.(5)Centers for Disease Control and Prevention, 2013–14 State, Regional, and National Vaccination Report II (Atlanta, GA: CDC, N.D.): http://www.cdc.gov/flu/fluvaxview/reportshtml/reporti1314/reportii/index.html (accessed 9/1/15). Effectiveness of the flu vaccine varies greatly from year to year based on the annual vaccine’s match with strains of flu virus circulating at the time as well as other factors. Nevertheless, even the 2014–2015 vaccine, which was not as well matched to the predominant strains during that season as some previous vaccines, was able to reduce the odds of influenza infection by almost one-fourth among those vaccinated in the United States.(6)Centers for Disease Control and Prevention, “Early Estimates of Seasonal Influenza Vaccination Effectiveness—United States, January 2015,” Morbidity and Mortality Weekly Report (MMWR), Jan. 16, 2015, 64(01): 10–15: http://www.cdc.gov/mmwr/preview/mmwrhtml/mm6401a4.htm (accessed 6/25/15).

Michiganders insured through Medicaid or the Healthy Michigan Plan (the state’s expanded Medicaid program) are able to receive annual flu vaccination without a copay.(7)Michigan Department of Community Health, MSA Bulletin 10-30 (Lansing, MI: Michigan Department of Community Health, Medical Services Administration, Aug. 10, 2010): https://michigan.fhsc.com/Downloads/ MSA_10-30_330003_7.pdf (accessed 8/20/15). The Healthy Michigan Plan encourages beneficiaries to choose vaccination by reducing annual out-of-pocket contributions by 50 percent for those with an annual household income above the federal poverty level who complete a Health Risk Assessment with their primary care office/clinic and identify a health behavior goal such as receiving a flu shot.(8)State of Michigan, Healthy Michigan Plan, MI Health Account (Lansing, MI: Healthy Michigan Plan, 2015): http://www.michigan.gov/healthymiplan/0,5668,7-326-67957_69564—,00.html (accessed 8/20/15). Because Healthy Michigan Plan beneficiaries whose income is below the federal poverty level are not required to make out-ofpocket contributions, many plans instead provide them with a $50 prepaid card or gift card for completing the Health Risk Assessment.(9)U nitedHealthcare, Healthy Michigan Plan – Health Risk Assessment
Provider FAQ’s (Southfield, MI: United Healthcare, April 2014): http://www.uhccommunityplan.com/content/dam/communityplan/healthcareprofessionals/providerinformation/MI-Provider-Information/MI_Healthy_Incentive_FAQ.pdf (accessed 8/20/15).
,(10)HealthPlus Partners Healthy Michigan, HealthPlus Partners will reward you for taking steps toward getting and staying healthy! (N.P.: HealthPlus, April 8, 2014): https://www.healthplus.org/uploadedFiles/PDFs/Healthy_Michigan/HMP%20HRA%20Member%20Incentives%20Letter%20050514.pdf (accessed 8/20/15). As one of the Affordable Care Act’s preventive health services, annual flu vaccinations are also available without a copay or deductible to many Michiganders with private insurance.(11)U .S. Centers for Medicare & Medicaid Services, Preventive Health Services for Adults (Baltimore, MD: U.S. Centers for Medicare and Medicaid Services, N.D.): https://www.healthcare.gov/preventive-care-benefits/ (accessed 6/25/15). This brief examines the factors affecting flu vaccination in Michigan and how current and future policy initiatives could improve vaccination rates.

The brief is based on data from the Center for Healthcare Research & Transformation’s 2014 Cover Michigan Survey of Michigan adults, fielded between September and November 2014. All reported differences are statistically significant at the p ≤ 0.05 level.

Key Findings

  • Less than half (45 percent) of Michigan adults surveyed reported having received a flu vaccination in the past 12 months, a proportion similar to the national average.
  • Only 37 percent of African-American respondents reported having been vaccinated against the flu in the 12 months prior to the survey, compared to 47 percent of white respondents.
  • Women were more likely than men to report having received the flu vaccine: 48 percent of women reported having been vaccinated as compared to only 42 percent of men.
  • About one in three respondents under the age of 40 (34 percent) reported having been vaccinated, compared to more than two-thirds (70 percent) of those over 65.
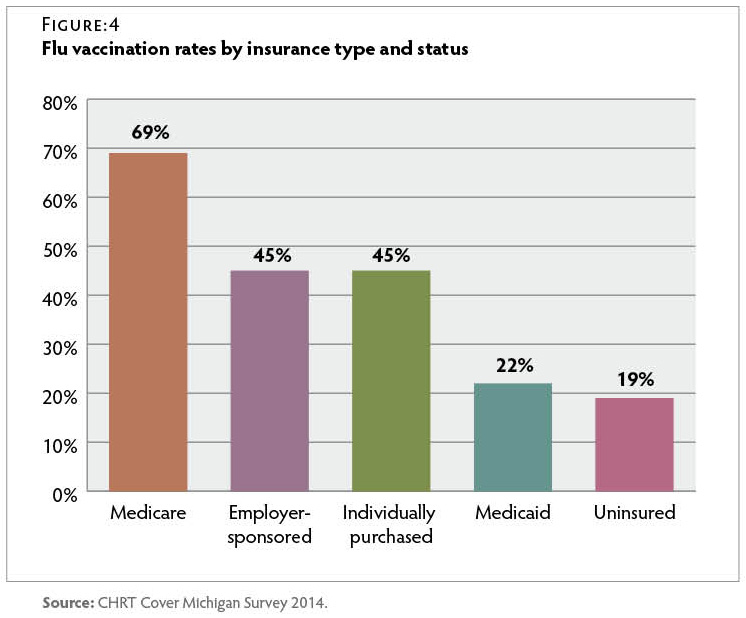
  • Only 22 percent of respondents with Medicaid and 19 percent of uninsured respondents reported having received the flu vaccine in the past 12 months, about half the rate of respondents with employer-sponsored or individually purchased insurance.
  • Forty-eight percent of respondents who usually sought care at a doctor’s office reported having been vaccinated, compared to only 35 percent of those whose usual source of care was an urgent care clinic and 30 percent of those whose usual source of care was an emergency department.

    Demographic Predictors of Vaccination

Forty-five percent of Michigan residents surveyed reported having received a flu vaccination in the 12 months before the survey. Forty-seven percent of white respondents reported having been vaccinated in the year leading up to the survey, compared to only 37 percent of African-American respondents.

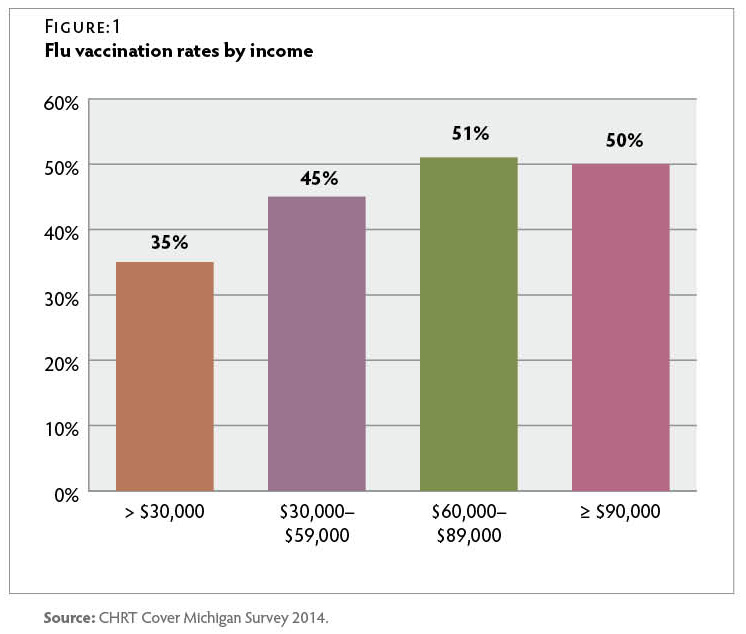
Only one-third of those whose income was less than $30,000 had been vaccinated, compared to half of those with an income above $30,000. Figure 1
CT958-CMS-Influenza-FIG1

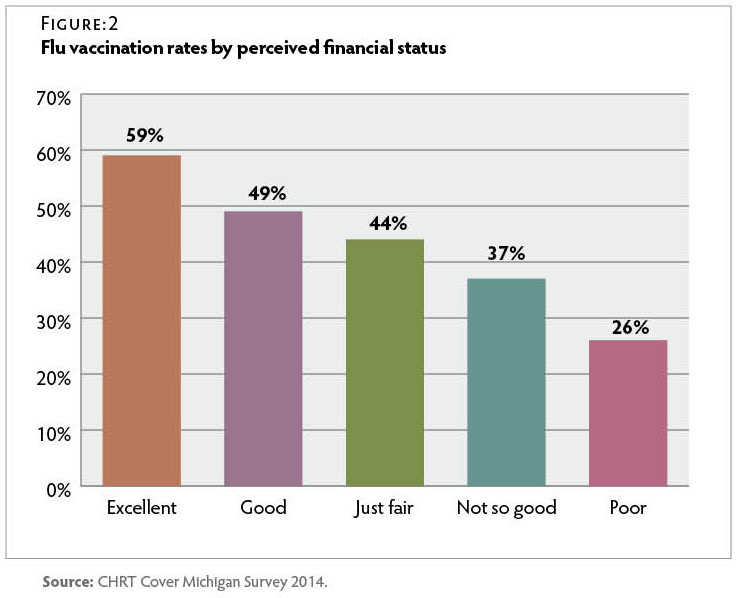
Perceived household financial status had an even stronger relationship with flu vaccination than did reported household income. Those who rated their household financial status as “excellent” were more than twice as likely to report having received a flu shot than were those who rated their household financial status as “poor.” Figure 2
CT958-CMS-Influenza-vFIG2

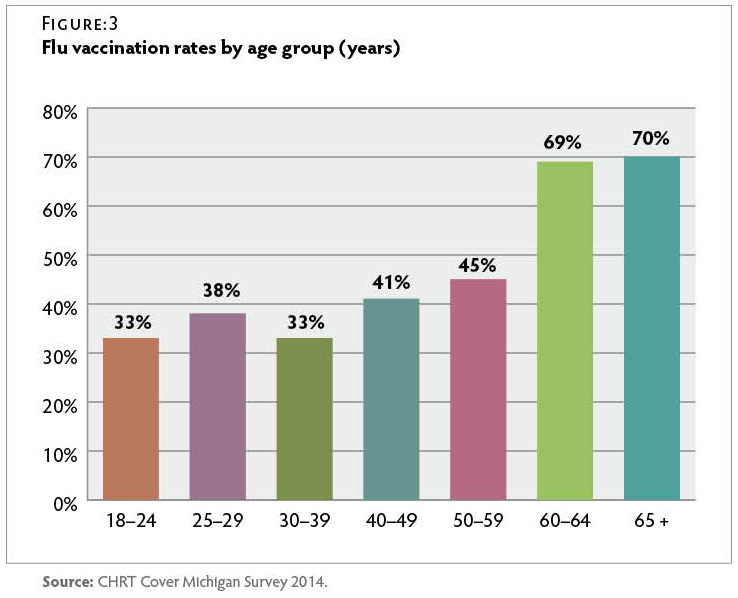
Michiganders over the age of 65 were twice as likely to report having received a flu vaccine as those under 40. Only 34 percent of those between the ages of 18 and 39 reported having been vaccinated in the past year. Figure 3
CT958-CMS-Influenza-vFIG3


Insurance Status and Vaccination

Survey respondents reported wide variations in vaccination rates varied based on insurance status. Only 19 percent of uninsured respondents reported that they had been vaccinated in the past year, compared to 48 percent of insured respondents. Michiganders with Medicare were most likely to report having received the flu vaccine, while those who were uninsured or had Medicaid were least likely to report having been vaccinated. Respondents with employer-sponsored or individually purchased insurance were almost twice as likely as those with Medicaid to report having received a flu vaccine. Less than one-quarter of respondents with Medicaid reported having been vaccinated in the 12 months prior to the survey. Figure 4
CT958-CMS-Influenza-FIG4


Source of Care and Vaccination

Half of Michiganders who reported that they had a primary care provider received a flu vaccine, compared to only 28 percent of respondents who did not have a primary care provider. Those who reported that they usually went to a doctor’s office when they were sick or needed medical advice were more likely to have been vaccinated than those who reported usually receiving care at an emergency department or urgent care clinic. Figure 5
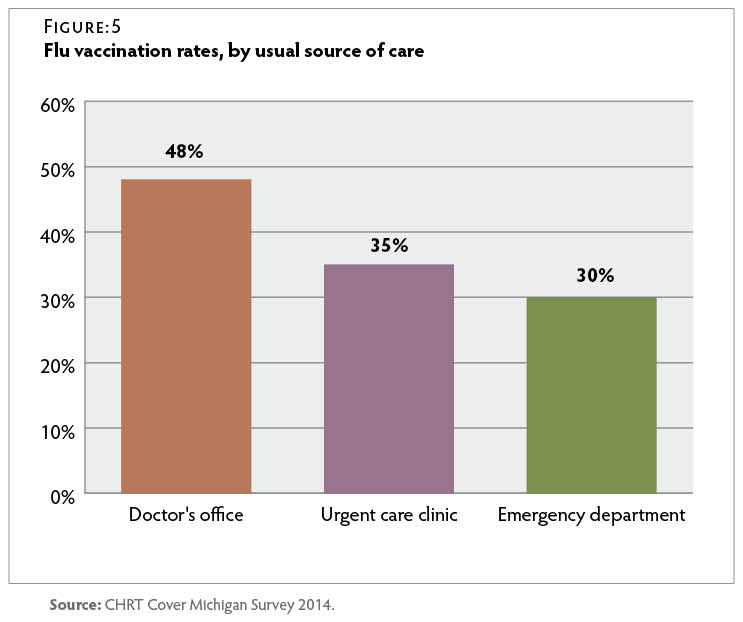
CT958-CMS-Influenza-FIG5


Conclusion

Despite recommendations that all individuals six months and older be vaccinated against the flu each year, less than half of Michigan adults surveyed reported having been vaccinated in the year leading up to this survey. Michigan residents whose income was less than $30,000 per year, those without a primary care provider and/or who relied on urgent care facilities or emergency departments for care, and those who had Medicaid or were uninsured were least likely to have been vaccinated. The low vaccination rates among these groups suggest a need for targeted future interventions. These data were collected too early in 2014 to fully reflect vaccination rates during the 2014–2015 flu season and therefore do not assess effectiveness of the Healthy Michigan Plan’s potential to effect changes in vaccination rates. It is possible that Michigan vaccination rates may increase as more Michiganders gain insurance coverage through the Medicaid expansion and the insurance marketplace, and as participation in the Healthy Michigan Plan’s incentive program expands.

Methodology

The survey data presented in this brief were produced from a series of survey questions added to the Michigan State University Institute for Public Policy and Social Research (IPPSR) quarterly State of the State Survey. The survey was fielded between September and November 2014 and included a sample of 1,002 Michigan adults, with a 20.2 percent response rate. The margin of error for the entire sample was ±3.9 percent. The sampling design, a random stratified sample based on regions within the state, was a telephone survey of Michigan residents conducted via landline and cellular phones.

For analytical purposes, survey data were weighted to adjust for the unequal probabilities of selection for each stratum of the survey sample (for example, region of the state, listed vs. unlisted telephones). Additionally, data were weighted to adjust for non-response based on age, gender, and race according to population distributions from 2009–2013 American Community Survey data. Respondents who reported both Medicare and Medicaid coverage or who reported coverage through the Healthy Michigan Plan were considered Medicaid recipients for the purpose of this analysis. Due to the timing of the survey, reported vaccination may have occurred during either the 2013–2014 flu season or during the 2014–2015 flu season. Results were analyzed using SAS 9.3 software. Statistical significance of bivariate relationships was tested using z tests or chi-square tests for independence. All comparison tables are statistically significant at the p ≤ 0.05 level unless otherwise noted. A full report of the IPPSR State of the State Survey methodology can be found at: http://ippsr.msu.edu/soss/.

READ THE REPORT


Suggested Citation: Mary L. Smiley, Melissa Riba, and Marianne Udow-Phillips, Flu Vaccination in Michigan:
Opportunities for Improvement. Cover Michigan Survey 2014 (Ann Arbor, MI: Center for Healthcare Research & Transformation, October 2015).

Acknowledgements: The staff at the Center for Healthcare Research & Transformation would like to thank Thomas Buchmueller, Matthew M. Davis, Robert Goodman, Helen Levy, Renuka Tipirneni, and the staff of the Institute for Public Policy and Social Research (IPPSR) at Michigan State University for their assistance with the design and analysis of the survey.

References

References
1 Centers for Disease Control and Prevention, “Estimates of Deaths Associated with Seasonal Influenza — United States, 1976–2007,” Morbidity and Mortality Weekly Report (MMWR), Aug. 27, 2010, 59(33): 1057–62: http://www.cdc.gov/mmwr/preview/mmwrhtml/mm5933a1.htm (accessed 6/25/15)
2 Michigan Department of Health & Human Services, “Influenza Surveillance Report for the Week Ending June 13, 2015,” MI Flu Focus, Influenza Surveillance Updates, (Lansing, MI: Michigan Department of Health & Human Services, Bureaus of Epidemiology and Laboratories, June 24, 2015), 12(23): http://www.michigan.gov/documents/mdch/MIFF_6-24-15_492747_7.pdf (accessed 6/25/15).
3 Centers for Disease Control and Prevention, Advisory Committee on Immunization Practices (ACIP) Reaffirms Recommendation for Annual Influenza Vaccination (Atlanta, GA: CDC, Feb. 26, 2015): http://www.cdc.gov/media/releases/2015/s0226-acip.html (accessed 6/25/15).
4 Centers for Disease Control and Prevention, Flu Vaccination Coverage, United States, 2013–14 Influenza Season (Atlanta, GA: CDC, September 14, 2014): http://www.cdc.gov/flu/fluvaxview/coverage-1314estimates.htm (accessed 9/1/15).
5 Centers for Disease Control and Prevention, 2013–14 State, Regional, and National Vaccination Report II (Atlanta, GA: CDC, N.D.): http://www.cdc.gov/flu/fluvaxview/reportshtml/reporti1314/reportii/index.html (accessed 9/1/15).
6 Centers for Disease Control and Prevention, “Early Estimates of Seasonal Influenza Vaccination Effectiveness—United States, January 2015,” Morbidity and Mortality Weekly Report (MMWR), Jan. 16, 2015, 64(01): 10–15: http://www.cdc.gov/mmwr/preview/mmwrhtml/mm6401a4.htm (accessed 6/25/15).
7 Michigan Department of Community Health, MSA Bulletin 10-30 (Lansing, MI: Michigan Department of Community Health, Medical Services Administration, Aug. 10, 2010): https://michigan.fhsc.com/Downloads/ MSA_10-30_330003_7.pdf (accessed 8/20/15).
8 State of Michigan, Healthy Michigan Plan, MI Health Account (Lansing, MI: Healthy Michigan Plan, 2015): http://www.michigan.gov/healthymiplan/0,5668,7-326-67957_69564—,00.html (accessed 8/20/15).
9 U nitedHealthcare, Healthy Michigan Plan – Health Risk Assessment
Provider FAQ’s (Southfield, MI: United Healthcare, April 2014): http://www.uhccommunityplan.com/content/dam/communityplan/healthcareprofessionals/providerinformation/MI-Provider-Information/MI_Healthy_Incentive_FAQ.pdf (accessed 8/20/15).
10 HealthPlus Partners Healthy Michigan, HealthPlus Partners will reward you for taking steps toward getting and staying healthy! (N.P.: HealthPlus, April 8, 2014): https://www.healthplus.org/uploadedFiles/PDFs/Healthy_Michigan/HMP%20HRA%20Member%20Incentives%20Letter%20050514.pdf (accessed 8/20/15).
11 U .S. Centers for Medicare & Medicaid Services, Preventive Health Services for Adults (Baltimore, MD: U.S. Centers for Medicare and Medicaid Services, N.D.): https://www.healthcare.gov/preventive-care-benefits/ (accessed 6/25/15).

Michigan Physician Survey: Primary care physician perspectives on innovative compensation models

A physician wearing a white coat and stethoscope.

One goal of the Affordable Care Act (ACA) is to “reduce the growth of health care costs while promoting high-value, effective care.” Provisions of the ACA encourage providers to engage in innovative alternatives to traditional fee-for-service compensation models with a focus on value-based purchasing through a variety of mechanisms.

The U.S. Department of Health and Human  Services also recently announced the goal of directing 30 percent of fee-for-service Medicare payments to these kinds of models by 2016 and 50 percent by 2018, up from 20 percent in 2015.

In order to understand how physicians in Michigan see the trajectory for change in compensation, the Center for Healthcare Research & Transformation (CHRT) collaborated with the University of Michigan faculty to survey primary care physicians statewide about their practices and innovative compensation models. The survey findings show that physicians across the state are actively anticipating significant changes in approaches to compensation and are already participating in many initiatives that begin the shift from straight fee-for-service payment to other models.

Key findings include:

  • 28 percent of Michigan primary care physicians reported participation in at least one innovative compensation model.
  • 41 percent of physicians reported expecting fee-for-service payments to decline, while 44 percent and 42 percent reported expecting fee-for-service with incentives and bundled payments (respectively) to increase as a percentage of their practice revenue over the next 1–3 years.
  • The Michigan Primary Care Transformation Project (MiPCT) was the value-based payment initiative that physicians in Michigan reported participating in most frequently in 2014.
  • Bundled payments were uncommon at the time of the survey: on average, physicians reported that only 3 percent of their practice revenue came from bundled payments, and only 5 percent of physicians reported participation in the Bundled Payments for Care Improvement initiative.

Suggested Citation: Smiley, Mary L.; Ndukwe, Ezinne G.; Riba, Melissa; Udow-Phillips, Marianne. Primary Care Physician Perspectives on Innovative Compensation Models. 2014 Michigan Physician Survey (Ann Arbor, MI: Center for Healthcare Research and Transformation, 2015).

Acknowledgements: The staff at the Center for Healthcare Research & Transformation would like to thank Thomas Buchmueller, Matthew M. Davis, Robert Goodman, Helen Levy, Renuka Tipirneni, and the staff of the Institute for Public Policy and Social Research (IPPSR) at Michigan State University for their assistance with the design and analysis of the survey.

READ THE BRIEF

Community mental health services: Coverage and delivery in Michigan

A cartoon profile with gears in the brain, symbolizing mental health.Since 1965, the number of Community Mental Health centers (CMHs) has increased from 12 covering 16 counties to 46 covering all 83 counties in Michigan.

Today, Medicaid is the major source of most funding for the publicly funded mental health system in Michigan, and care at CMHs is an entitled benefit under Medicaid. As such, individuals with Medicaid coverage are more likely to receive care through CMHs than uninsured and underinsured individuals.

Furthermore, CMHs providing care for non-Medicaid covered individuals in Michigan must use limited state general fund dollars to cover their care. State general fund dollars are allocated to each CMH based on historical funding formulas that are modified at the state’s discretion. Changes to the allocations have related to administrative expenses, previous general fund transfers between CMHs (under Public Act 236), and an effort to bring all CMHs to the same level of funds based on county populations.

Beginning in 2014, general fund dollars to CMHs were reduced substantially as a result of the state’s decision to expand Medicaid under the Patient Protection and Affordable Care Act. Medicaid funds are allocated monthly to each CMH through PIHPs according to the number of Medicaid beneficiaries in the PIHP’s service area. Decreases in general funds in recent years have threatened the ability of CMHs to deliver care to many of those in need. (See Appendix B for details about the flow of funding streams.) That is, only non-Medicaid patients with the most severe mental illness or developmental disabilities (“priority populations” under the Michigan Mental Health Code) receive care through CMHs.

Non-Medicaid eligibles may also be subject to waiting lists at CMHs, while individuals covered by Medicaid are not. Emergency cases are an exception, and are treated immediately regardless of a person’s ability to pay. Of the 227,020 people served at CMHs in Michigan in 2010, 69 percent were covered by Medicaid.

READ THE BRIEF

Health care use variation in Michigan

A graph showing "medical care" trending upwards.For more than 20 years, researchers at the Dartmouth Institute for Health Policy and Clinical Practice have been sharing data on regional variation in the use of health care services: Variation that does not seem to be explained by health status or other relevant differences among the populations studied.

Most of work done on geographic variation has been done on the Medicare population, and some could argue that the phenomenon of variation is unique to a senior population or some specific attribute of the Medicare structure. However, just over 10 years ago, we in Michigan were fortunate to have the opportunity to collaborate with our colleagues at Dartmouth to look at this same kind of data in the commercial Blue Cross and Blue Shield of Michigan (BCBSM) population. Our findings then showed that patterns of geographic variation in the commercial population were similar to those found in the Medicare population.

In this report, we are again comparing the commercial BCBSM population to the Medicare population, but we are also looking at changes within the commercial population in overall health care use and geographic variation over the past 10 years. Overall, this report depicts an improving picture in some key areas, showing notable reductions in overall use for some procedures often considered to be “over-utilized”—particularly in cardiac care and ambulatory care sensitive conditions. And, these trends look different (and better) for the BCBSM population than they do nationally.

Even among procedures with improving overall trends, however, some areas of the state continue to have very high use rates and unexplained variation. And some procedures often considered to be over-utilized do not show improving trends between 1997 and 2008; notably, Cesarean section, computed tomography (CT) scans of the low back, and back surgery. Finally, while there are some important exceptions, patterns of regional variation are similar between BCBSM and Medicare; that is, areas with high use rates in Medicare tend to have high use rates for BCBSM. And, for the most part, areas that had high use in 1997 still had relatively high use in 2008.

READ THE REPORT

Cover Michigan 2010: The state of health care coverage in Michigan

A cityscape.Cover Michigan 2010 is CHRT’s annual report of health care coverage in the U.S. and Michigan, including data on the uninsured, publicly and privately insured, premiums and cost-sharing, the health care safety net and, new for this year, health reform (also available separately in the CHRT Issue Brief, Impact of Health Reform on Coverage in Michigan).

Cover Michigan 2010 presents the most recent comparative data available for the U.S. and Michigan: 2008 data for the U.S. and 2007/2008 two-year pooled data for the state. Michigan data are pooled to ensure an adequate sample size; some demographic data are reported as three-year pooled averages. Where possible, more recent data are included.

The report and the Cover Michigan Survey 2010 (released in March 2010) both reveal continued upward trends in areas of concern from our 2009 report: more people lacking insurance, more employers dropping coverage, higher costs for those who have insurance, and a growing strain on the health care safety net.

Important trends noted in Cover Michigan 2010 include:

  • The numbers of uninsured and publicly insured in our state have been growing. More than 3.8 million Michigan citizens were either uninsured or covered by a public program (Medicare, Medicaid, military)—almost 39 percent of the state’s population;
  • Despite the growth in public coverage, many of the poor did not have coverage at all: 37 percent of those with incomes below the poverty line did not have coverage in 2007/2008;
  • While Michigan still has a higher percentage of those with private coverage than most states (ranking ninth highest), businesses in Michigan have been dropping coverage at a faster rate than the U.S. overall and the percent of Michigan’s population with private coverage was 4.5 percent lower in 2007/2008 than it was in 2003/2004;
  • Average Michigan family premiums continue to be less than the U.S. average, at $11,321 compared to $12,298— making Michigan the ninth lowest state in average family premiums in 2008;
  • Reflecting the increase in the number of uninsured in the state and the increase in copayments and deductibles faced by those with insurance, uncompensated care in hospitals increased in 2008 to $2 billion, a 94 percent increase since 2004;
  • “Safety net” providers in Michigan are critically important for many of those most in need, but these providers are challenged to meet demand for their services. Also, Michigan has fewer such providers than many other states: Michigan ranked 31st in the nation for the number of federally qualified health center sites per 10,000 uninsured.

We predict these 2008 trends will continue in the 2009 data. If anything, given the dramatic economic events of 2009, they will likely reflect even steeper changes in the same directions. There is no question the trends evident in this report depict both the reasons health reform was a major national policy issue in 2009 and some of the challenges it will face.

READ THE BRIEF