This issue brief estimates the size of the non-elderly underinsured population in Michigan and in the United States in 2013 and analyzes several social and economic characteristics associated with the underinsured in Michigan, prior to the implementation of the major coverage provisions of the Affordable Care Act (ACA) in 2014. The brief also discusses the challenges faced by the underinsured and the likely impacts of the ACA’s coverage provisions and other policy changes on this vulnerable population.
Over the last decade, consumers’ share of health care spending has steadily increased in the form of higher premiums and cost-sharing for services. The average deductible for employer-sponsored family coverage in Michigan more than doubled from 2003 to 2013, rising from $744 to $2,064. Deductibles for employer-sponsored individual coverage in Michigan more than tripled over the same period, increasing from $365 to $1,123.(1)Agency for Healthcare Research and Quality, Medical Expenditure Panel Survey– Insurance Component, 2003 and 2013: http://meps.ahrq.gov/mepsweb/data_stats/quick_tables.jsp#insurance (accessed 7/6/2015). At the same time, wage growth averaged only 15 percent over the same period.(2)Bureau of Labor Statistics, Occupational Employment Statistics, 2003 and 2013: http://www.bls.gov/oes/tables.htm (accessed 7/6/2015).,(3)Deductible and wage data reported as nominal, not adjusted for inflation. As a result, many Americans are considered “underinsured,” meaning medical costs not covered by insurance exceed 5 percent of income for those with household income less than 200 percent of the federal poverty level (FPL), or 10 percent of income for those above 200 percent.
The increase in out-of-pocket costs has made it more difficult for many consumers in Michigan to afford needed care, even though they have insurance. The 2012 CHRT Cover Michigan Survey found that 42 percent of Michiganders cited cost as a reason for not seeking needed medical care in 2012 and 27 percent reported struggling to pay medical bills.(4)M. Smiley, M. Riba, E. Ndukwe, and M. Udow-Phillips, Cover Michigan Survey: Coverage and Health Care Access (Ann Arbor, MI: Center for Healthcare Research and Transformation, March 2015): https://chrt.org/publication/cover-michigan-survey-2014-coverage-and-health-care-access/. Some consumers with high co-pays or deductibles may also not be able to pay their portion of the cost of care that they do receive, resulting in uncompensated care for providers. From 2007 to 2013, uncompensated care costs for Michigan hospitals grew from $722 million to $982 million.(5)Uncompensated care includes both bad debt for uncollected bills and charity care write-offs for uninsured and low-income patients. CHRT calculation using Healthcare Cost Report Information System data from the Centers for Medicare and Medicaid Services at https://www.cms.gov/Research-Statistics-Dataand-Systems/Downloadable-Public-Use-Files/Cost-Reports/?redirect=/CostReports/ (accessed 1/23/15).
Key Findings
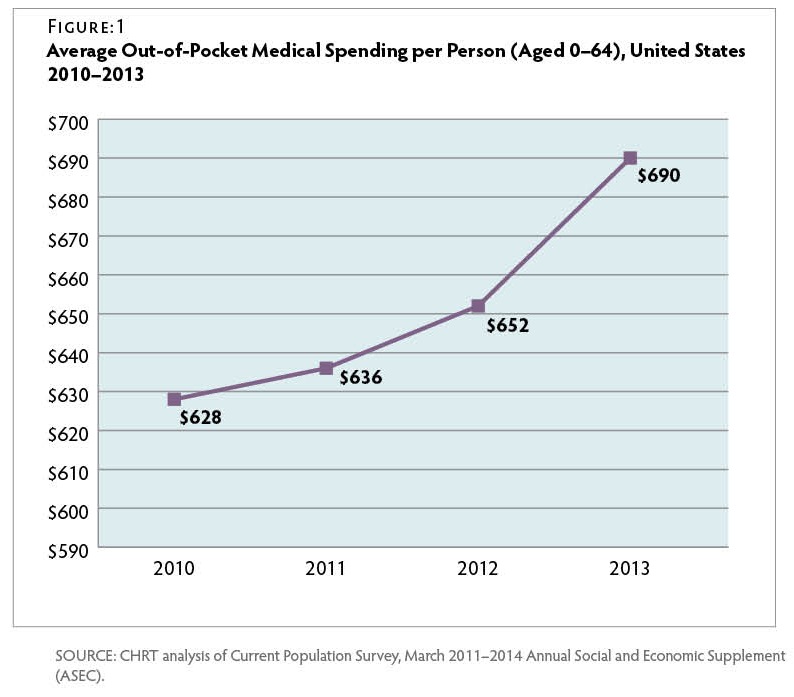
- Nationally, average out-of-pocket medical spending per capita grew almost 6 percent in just one year, 2012 to 2013. Over this same period, average family deductibles for employer-based coverage grew over 7 percent, while wages grew less than 2 percent.
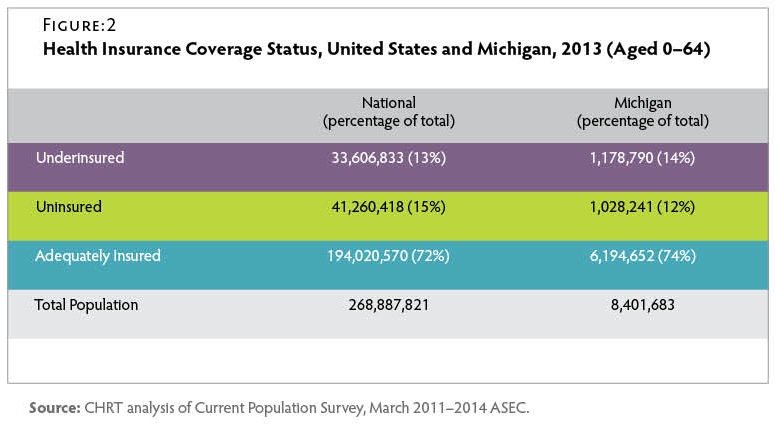
- The share of Michigan residents with adequate insurance in 2013 (74 percent) slightly exceeded the share nationwide (72 percent).
- In 2013, nearly 1.2 million Michigan residents were underinsured, exceeding the total of approximately 1 million residents without health insurance.
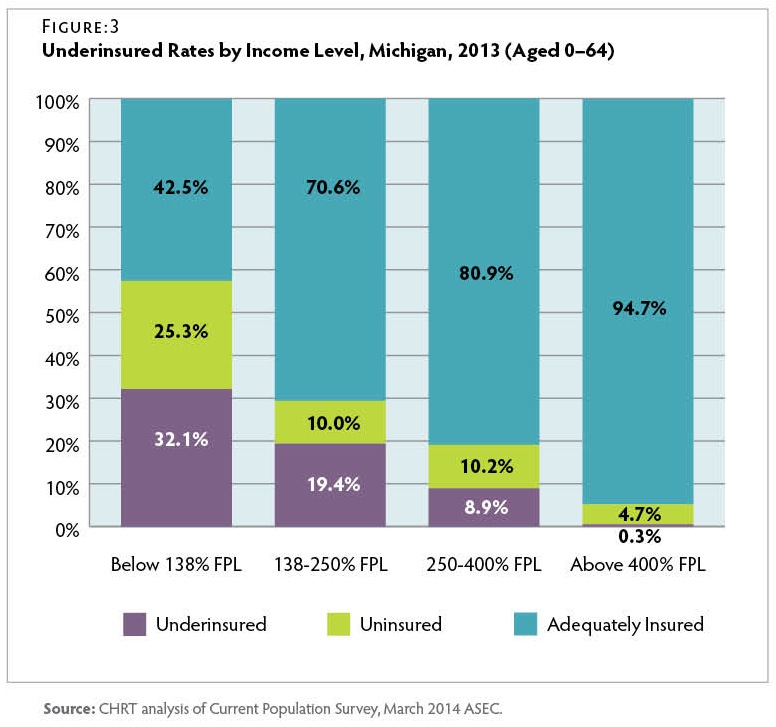
- Nearly 1.3 million people whose income was less than 138 percent of FPL were either underinsured (721,000) or uninsured (568,000) in 2013. A large share of this population became eligible for the Healthy Michigan Plan (Medicaid expansion) in April 2014.
- Children up to age 18 had the lowest uninsured rate but were the most likely to be in an underinsured family (17 percent underinsured).
- Workers in the leisure, hospitality, and service industries were the least likely to be adequately insured (63.9 percent). Among workers with health insurance, workers in the mining and construction industries were the most likely to be underinsured (12.7 percent).
Definition of Underinsured
In this brief, we evaluated underinsurance by measuring the economic costs of high out-of-pocket medical spending for people covered by health insurance. While this approach provides a clear definition of underinsurance, it does not necessarily capture people with insufficient benefits, unmet healthcare needs, or dissatisfaction with their coverage who forgo needed healthcare for these reasons.(6)State Health Access Data Assistance Center (SHADAC), Measuring the Adequacy of Coverage or Underinsurance (Minneapolis, MN: SHADAC, Jan. 2004): http://www.shadac.org/publications/measuring-adequacy-coverage-or-underinsurance (accessed 7/6/2015). Therefore, this analysis likely provides a conservative estimate of the number of underinsured residents in Michigan.
We adopted a definition of underinsurance developed by the Commonwealth Fund, which used two thresholds to identify the underinsured: residents with health insurance in families below 200 percent of the FPL with out-of-pocket medical spending (excluding premiums) that exceeded 5 percent of family income; or 10 percent if family income was above 200 percent of FPL.(7)C. Schoen, S. Hayes, S. Collins et al., America’s Underinsured: A State-by-State Look at Health Insurance Affordability Prior to the New Coverage Expansions (New York and Washington, DC: The Commonwealth Fund, March 2014): http://www.commonwealthfund.org/publications/fund-reports/2014/mar/americas-underinsured (accessed 7/6/2015). Residents who were insured but did not fall under either of these thresholds were considered adequately insured. We analyzed the non-elderly population (aged 0-64) using data from the U.S. Census Bureau’s Current Population Survey (CPS). For a detailed explanation of how we measured underinsurance, see the methodology section.
Underinsured Definition:
- Family income is below 200 percent FPL and out-of-pocket medical spending is greater than 5 percent of income; or
- Family income is above 200 percent FPL and out-of-pocket medical spending is greater than 10 percent of income.
Issues for the Underinsured
A growing body of evidence has shown that a lack of adequate insurance can leave consumers exposed to high medical costs that they are unable to afford. In a recent survey of adults aged 19 to 64, half of those who were identified as underinsured reported problems paying medical bills or were currently paying off medical debt, which is equal to the rate of uninsured adults experiencing these issues. About one-quarter of underinsured adults reported having to change their way of life to pay medical bills, while only 7 percent of adequately insured adults had to make changes. About 7 percent of underinsured adults had to declare bankruptcy due to medical debt.(8)S. Collins, P. Rasmussen, S. Beutel, and M. Doty, The Problem of Underinsurance and How Rising Deductibles Will Make It Worse—Findings from the Commonwealth Fund Biennial Health Insurance Survey (New York and Washington, DC: The Commonwealth Fund, May 2015): http://www.commonwealthfund.org/publications/issue-briefs/2015/may/problem-of-underinsurance (accessed 7/6/2015).
Underinsured adults are more likely than those who are adequately insured to forgo needed health care due to costs. Almost half (44 percent) of underinsured adults reported not getting needed care because of cost in the past year, compared to 23 percent of adequately insured adults. The underinsured were about twice as likely as adequately insured adults to not fill prescriptions; skip medical tests, treatments, or follow-ups recommended by a doctor; and not see a specialist when a doctor recommended it.(9)Ibid. Further, studies have shown that families enrolled in consumer-directed health plans(10)Consumer-directed health plans are health insurance plans with high deductibles ($1,000 or more for an individual) as well as tax-exempt health reimbursement arrangements or health savings accounts. use less preventive care than families in traditional plans.(11)A. Haviland, M. Marquis, R. McDevitt, and N. Sood, “Growth of Consumer-Directed Health Plans to One-Half of All Employer-Sponsored Insurance Could Save $57 Billion Annually.” Health Affairs, May 2012, 31(5): 1009–15: http://content.healthaffairs.org/content/31/5/1009.abstract (accessed 7/6/2015). Forgoing needed medical care has a direct impact on health outcomes. Among adults with a health problem or condition, underinsured adults were almost twice as likely to stay overnight in a hospital or visit the ER because of their health condition as adequately insured adults.(12)S. Collins et al., May 2015.
Out-of-Pocket Medical Spending Trends
From 2010 to 2013, average national out-of-pocket per capita medical spending (excluding premiums) increased from $628 per person to $690 per person—an average annual increase of 3.2 percent. Figure 1 However, from 2012 to 2013, such spending increased 5.8 percent—likely due to growing copays and deductibles, higher rates of insurance coverage, economic growth leading to more disposable income, or some combination of these factors. Nationally, from 2012 to 2013, the average family deductible for employer-based coverage grew by over 7 percent to nearly $2,500 per year.(13)Agency for Healthcare Research and Quality, Medical Expenditure Panel Survey – Insurance Component, 2013: http://meps.ahrq.gov/mepsweb/data_stats/quick_tables.jsp#insurance (accessed 7/6/2015). By comparison, average worker wages increased by only 1.9 percent over the same period.(14)Bureau of Labor Statistics, Employment Cost Index: Historical Listing, April 2015: http://www.bls.gov/web/eci/echistrynaics.pdf (accessed 7/6/2015).
Michigan Underinsured Population in 2013
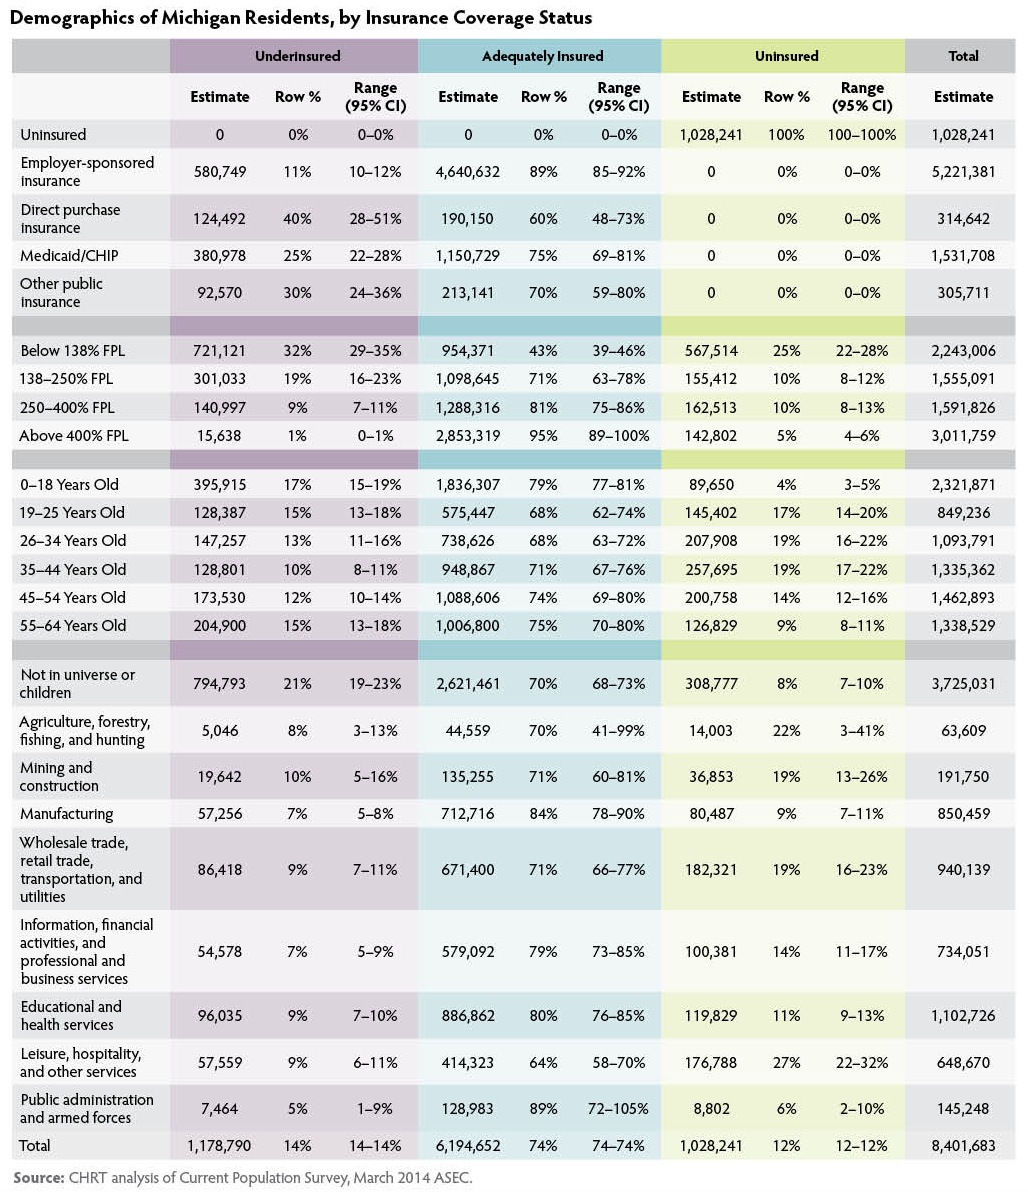
In 2013, nearly 1.2 million Michigan residents were underinsured. Figure 2 By comparison, approximately 1 million residents lacked health insurance coverage during that time. While Michigan’s underinsured rate of 14 percent just exceeded the national rate of 13 percent, a slightly larger share of Michigan residents had adequate insurance coverage (74 percent) than the share nationwide (72 percent).
Underinsurance in Michigan is concentrated in certain subpopulations, such as those with low incomes or those with coverage purchased through the individual (private, non-group) market. The following sections describe the characteristics of the underinsured population and where underinsurance was most likely to occur in 2013. Detailed tables are available in the Appendix.
Underinsured by Income
In Michigan, underinsured rates varied considerably by income level in 2013. Figure 3 More than 32 percent of residents with incomes below 138 percent FPL were underinsured, and an additional 25 percent lacked insurance coverage entirely. Figure 3 A significant share of this population became eligible for the Healthy Michigan Plan (Medicaid expansion) in April 2014.(15)Populations not eligible for the Healthy Michigan Plan include those eligible for traditional Medicaid or Medicare, unauthorized immigrants, or authorized immigrants with less than five years of residency. More than 19 percent of residents with incomes between 138 and 250 percent FPL were underinsured in 2013. Residents in this income range who became eligible for premium tax credits on the health insurance marketplace in 2014 were also eligible for cost-sharing reductions to lower their deductibles, co-pays, and other out-of-pocket costs if they selected a silver plan. Michigan residents with incomes greater than 250 percent FPL were more likely to be uninsured than underinsured in 2013.
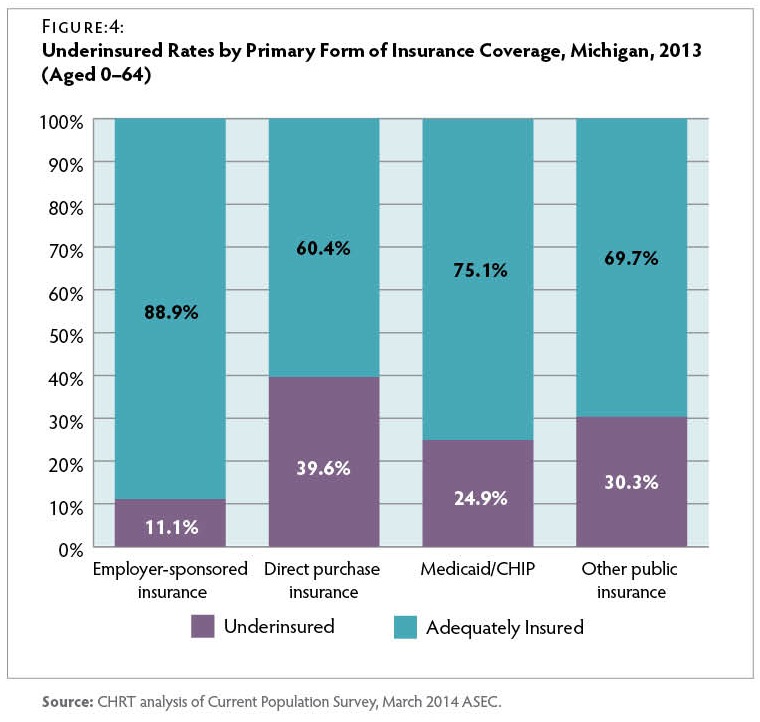
Underinsured by Primary Form of Heath Insurance
Form of Health Insurance Rates of underinsurance also varied considerably by the type of health insurance residents had in 2013. Figure 4 Among those with private insurance, the underinsurance rate was nearly four times greater for those who directly purchased coverage on the individual (private, non-group) market (39.6 percent) compared to those enrolled in group coverage through an employer (11.1 percent). Similarly, a CHRT survey fielded in 2012, before major ACA reforms took effect, found that consumers with individual market coverage were the least satisfied with their health insurance (45 percent rated their coverage as “fair” or “poor”).(16)D. Young, A. Hammoud, M. Udow-Phillips, et al., Satisfaction with Health Care Coverage. Cover Michigan Survey 2013 (Ann Arbor, MI: Center for Healthcare Research & Transformation, July 2013): https://chrt.org/publication/satisfaction-health-care-coverage/.
Nearly 25 percent of residents enrolled in either Medicaid or the Children’s Health Insurance Program (CHIP) were underinsured in 2013. This result is unexpected, since most Medicaid enrollees were protected by an aggregate cap on total premium and cost-sharing expenses at 5 percent of family income—effectively lower than the underinsured threshold for lowincome families.(17)R. Rudowitz and L. Snyder, Premiums and Cost-Sharing in Medicaid (N.p.: Kaiser Commission on Medicaid and the Uninsured, Feb. 2013): http://kff.org/medicaid/issue-brief/premiums-andcost-sharing-in-medicaid/ (accessed 7/6/2015). While the full causes of underinsurance among Medicaid/ CHIP enrollees are not clear, about half of the Medicaid/CHIP underinsured in Michigan had at least one family member not covered by Medicaid/CHIP. In other words, many Medicaid/CHIP enrollees have their own financial protection from high out-of-pocket costs but could still be underinsured due to the costs their family members incurred.
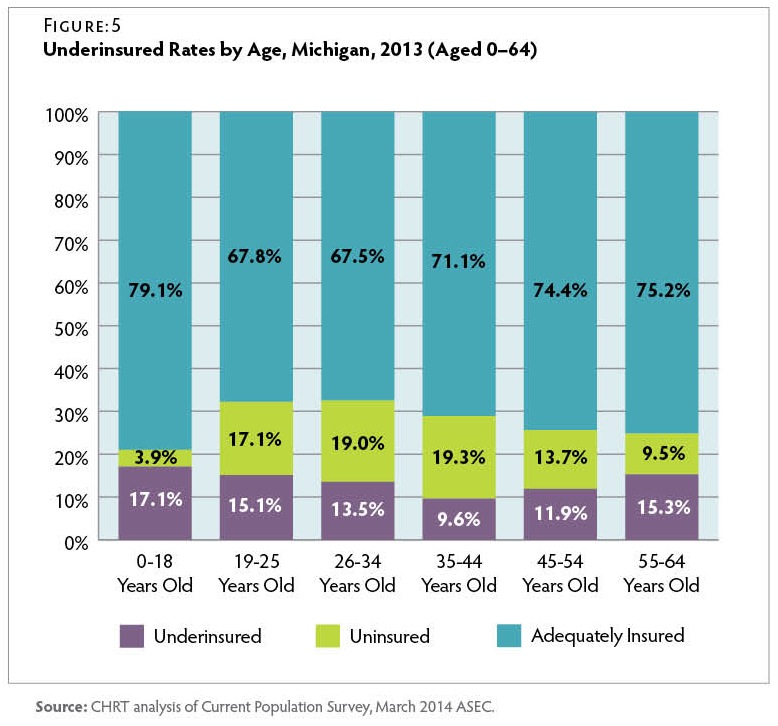
Underinsured by Age
Underinsurance rates also varied across the age spectrum for Michigan residents in 2013. Figure 5 Children up to age 18 had the lowest rates of uninsurance (3.9 percent) but were the most likely to be in an underinsured family (17.1 percent). In older population groups, underinsured rates reach their lowest point for adults between the ages of 35 and 44 years (9.6 percent). However, after this point, underinsured rates rise again, reaching 15.3 percent for those between the ages of 55 and 64 years, who are approaching Medicare eligibility.
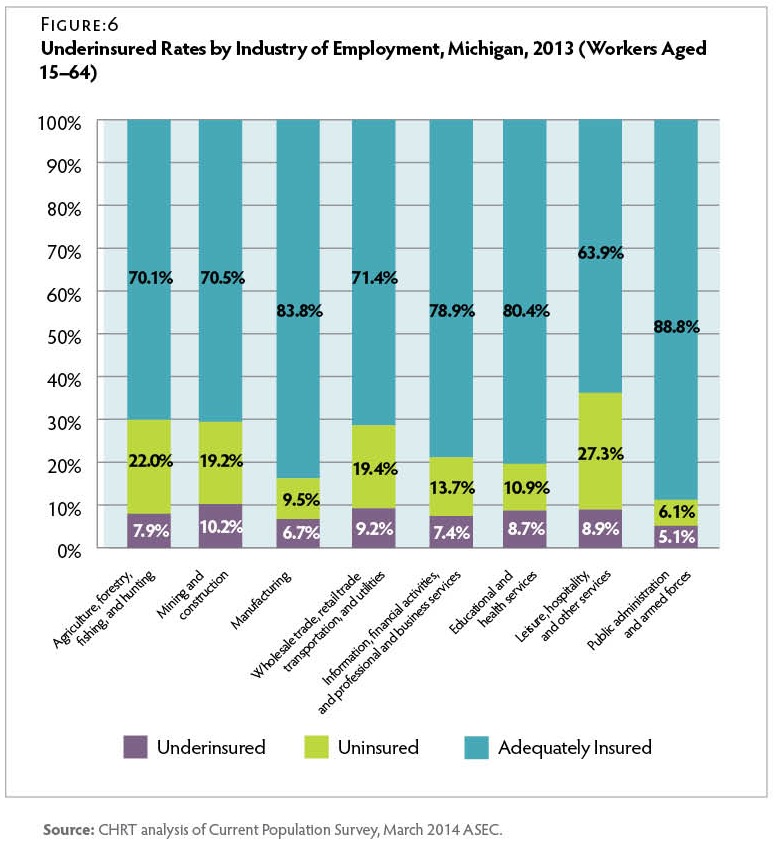
Underinsured by Industry
Among employed workers in Michigan in 2013, more than 80 percent of workers in the manufacturing, public administration (government), and health and education service industries were adequately insured. Figure 6 On the other hand, less than two-thirds of workers in the leisure, hospitality, and other services industries had adequate coverage. Lack of any coverage was a particular concern in these industries, with over 27 percent of workers being uninsured.
Regardless of whether they received insurance coverage through an employer or another source, almost 10 percent of insured workers were underinsured in 2013. Among covered workers, underinsurance rates were highest for those in the mining and construction industries (12.7 percent) and lowest for workers in public administration (5.5 percent). This could reflect varying degrees of collective bargaining, health plan generosity, and wage levels across these industries.
Conclusion
Over the last decade, Michigan residents with private coverage have experienced large increases in their health insurance deductibles and out-of-pocket costs for medical care. These trends resulted in an underinsured population even larger than the number of those without insurance. Underinsurance is a particularly prevalent issue for low-income families, including individuals in those families who are covered by Medicaid or CHIP and had robust cost-sharing protections for their own medical expenses.
While the Affordable Care Act expanded health insurance coverage through the health insurance marketplace and Medicaid expansion in 2014, it is not yet clear whether the newly insured will all find adequate coverage or what effect the law will have on those who were previously insured. The ACA provides cost-sharing reductions to low-income enrollees on the health insurance marketplace, and nearly all Americans with private insurance now have standardized caps on out-ofpocket spending and coverage for certain preventive services without cost-sharing. However, the overall effect of these ACA provisions on reducing underinsurance is not yet known.
In addition, employers continue to adjust their health plans by increasing consumer cost-sharing and considering new benefit designs such as defined contribution plans. These trends are important to monitor as they have broad implications for consumers, employers who offer health insurance, and providers who treat patients with insurance that requires significant out-of-pocket liabilities.
Methodology
Underinsured Data
This issue brief uses data from the Census Bureau’s Current Population Survey (CPS), a monthly economic survey of households across the United States.(18)Data downloaded from the National Bureau of Economic Research at http://www.nber.org/data/current-population-survey-data.html (accessed 4/8/2015). Around March every year, the CPS conducts the Annual Social and Economic Supplement (ASEC), which includes additional questions about health insurance coverage and out-of-pocket spending on medical care and insurance premiums for the previous year.(19)The Census Bureau has redesigned the health insurance questions for the 2015 ASEC. For the 2014 ASEC, the Census Bureau tested the questions
with five-eighths of the sample receiving the original questions, while the remaining three-eighths received the redesigned questions. This brief analyzed the respondents of the original questions. Therefore, it is unclear whether future underinsured analyses of the 2015 ASEC data will be directly comparable to this issue brief. For example, the 2014 ASEC asks respondents about the coverage they had over the course of 2013. This is considerably different from the American Community Survey data used in other CHRT briefs, which is limited to health insurance coverage at the point in time when respondents answer the survey.
To identify Michigan residents that were underinsured, we adopted the underinsured definition developed by the Commonwealth Fund in their March 2014 report.(20)C. Schoen, et al., March 2015. Special thanks to David Radley, PhD, of The Institute for Healthcare Improvement and The Commonwealth Fund and
Claudia Solis-Roman of New York University for explaining their underinsured methodology and addressing our technical questions. Individuals were identified as underinsured if they had health insurance and their family’s out-of-pocket medical spending (including both medical and over-the-counter spending but not premiums) exceeded certain family income thresholds, specifically, out-of-pocket medical spending exceeding 5 percent of family income if family income was below 200 percent of the federal poverty level (FPL) and out-of-pocket spending exceeding 10 percent of family income if family income was greater than 200 percent FPL. We restricted our analysis to nonelderly Michigan residents (aged 0–64).
Families were identified within households if they shared the same health insurance unit (HIU). HIUs are designed to resemble tax filing units, which are the logical groupings used to calculate income levels and eligibility for many financial assistance programs, including Medicaid and ACA tax credits. The HIU definition in this issue brief was developed by the Commonwealth Fund and differs slightly from the HIU definition developed by the State Health Access Data Assistance Center (SHADAC)(21)State Health Access Data Assistance Center (SHADAC), Defining Family for Studies of Health Insurance Coverage (Minneapolis, MN: University of Minnesota, March 2012): http://www.shadac.org/publications/defining-family-studies-healthinsurance-coverage (accessed 7/6/2015). used in previous CHRT briefs. Demographic and economic variables collected in the ASEC were used to generate cross-tabulations. Also, replicate weights were merged with the ASEC data to calculate the confidence intervals found in the Appendix.
Appendix
Suggested Citation: Fangmeier, Joshua; Corneail, Leah; Udow-Phillips, Marianne. The Underinsured in Michigan, 2013. Cover Michigan 2015 (Ann Arbor, MI: Center for Healthcare Research and Transformation, 2015).
References
| ↑1 | Agency for Healthcare Research and Quality, Medical Expenditure Panel Survey– Insurance Component, 2003 and 2013: http://meps.ahrq.gov/mepsweb/data_stats/quick_tables.jsp#insurance (accessed 7/6/2015). |
|---|---|
| ↑2 | Bureau of Labor Statistics, Occupational Employment Statistics, 2003 and 2013: http://www.bls.gov/oes/tables.htm (accessed 7/6/2015). |
| ↑3 | Deductible and wage data reported as nominal, not adjusted for inflation. |
| ↑4 | M. Smiley, M. Riba, E. Ndukwe, and M. Udow-Phillips, Cover Michigan Survey: Coverage and Health Care Access (Ann Arbor, MI: Center for Healthcare Research and Transformation, March 2015): https://chrt.org/publication/cover-michigan-survey-2014-coverage-and-health-care-access/. |
| ↑5 | Uncompensated care includes both bad debt for uncollected bills and charity care write-offs for uninsured and low-income patients. CHRT calculation using Healthcare Cost Report Information System data from the Centers for Medicare and Medicaid Services at https://www.cms.gov/Research-Statistics-Dataand-Systems/Downloadable-Public-Use-Files/Cost-Reports/?redirect=/CostReports/ (accessed 1/23/15). |
| ↑6 | State Health Access Data Assistance Center (SHADAC), Measuring the Adequacy of Coverage or Underinsurance (Minneapolis, MN: SHADAC, Jan. 2004): http://www.shadac.org/publications/measuring-adequacy-coverage-or-underinsurance (accessed 7/6/2015). |
| ↑7 | C. Schoen, S. Hayes, S. Collins et al., America’s Underinsured: A State-by-State Look at Health Insurance Affordability Prior to the New Coverage Expansions (New York and Washington, DC: The Commonwealth Fund, March 2014): http://www.commonwealthfund.org/publications/fund-reports/2014/mar/americas-underinsured (accessed 7/6/2015). |
| ↑8 | S. Collins, P. Rasmussen, S. Beutel, and M. Doty, The Problem of Underinsurance and How Rising Deductibles Will Make It Worse—Findings from the Commonwealth Fund Biennial Health Insurance Survey (New York and Washington, DC: The Commonwealth Fund, May 2015): http://www.commonwealthfund.org/publications/issue-briefs/2015/may/problem-of-underinsurance (accessed 7/6/2015). |
| ↑9 | Ibid. |
| ↑10 | Consumer-directed health plans are health insurance plans with high deductibles ($1,000 or more for an individual) as well as tax-exempt health reimbursement arrangements or health savings accounts. |
| ↑11 | A. Haviland, M. Marquis, R. McDevitt, and N. Sood, “Growth of Consumer-Directed Health Plans to One-Half of All Employer-Sponsored Insurance Could Save $57 Billion Annually.” Health Affairs, May 2012, 31(5): 1009–15: http://content.healthaffairs.org/content/31/5/1009.abstract (accessed 7/6/2015). |
| ↑12 | S. Collins et al., May 2015. |
| ↑13 | Agency for Healthcare Research and Quality, Medical Expenditure Panel Survey – Insurance Component, 2013: http://meps.ahrq.gov/mepsweb/data_stats/quick_tables.jsp#insurance (accessed 7/6/2015). |
| ↑14 | Bureau of Labor Statistics, Employment Cost Index: Historical Listing, April 2015: http://www.bls.gov/web/eci/echistrynaics.pdf (accessed 7/6/2015). |
| ↑15 | Populations not eligible for the Healthy Michigan Plan include those eligible for traditional Medicaid or Medicare, unauthorized immigrants, or authorized immigrants with less than five years of residency. |
| ↑16 | D. Young, A. Hammoud, M. Udow-Phillips, et al., Satisfaction with Health Care Coverage. Cover Michigan Survey 2013 (Ann Arbor, MI: Center for Healthcare Research & Transformation, July 2013): https://chrt.org/publication/satisfaction-health-care-coverage/. |
| ↑17 | R. Rudowitz and L. Snyder, Premiums and Cost-Sharing in Medicaid (N.p.: Kaiser Commission on Medicaid and the Uninsured, Feb. 2013): http://kff.org/medicaid/issue-brief/premiums-andcost-sharing-in-medicaid/ (accessed 7/6/2015). |
| ↑18 | Data downloaded from the National Bureau of Economic Research at http://www.nber.org/data/current-population-survey-data.html (accessed 4/8/2015). |
| ↑19 | The Census Bureau has redesigned the health insurance questions for the 2015 ASEC. For the 2014 ASEC, the Census Bureau tested the questions with five-eighths of the sample receiving the original questions, while the remaining three-eighths received the redesigned questions. This brief analyzed the respondents of the original questions. Therefore, it is unclear whether future underinsured analyses of the 2015 ASEC data will be directly comparable to this issue brief. |
| ↑20 | C. Schoen, et al., March 2015. Special thanks to David Radley, PhD, of The Institute for Healthcare Improvement and The Commonwealth Fund and Claudia Solis-Roman of New York University for explaining their underinsured methodology and addressing our technical questions. |
| ↑21 | State Health Access Data Assistance Center (SHADAC), Defining Family for Studies of Health Insurance Coverage (Minneapolis, MN: University of Minnesota, March 2012): http://www.shadac.org/publications/defining-family-studies-healthinsurance-coverage (accessed 7/6/2015). |

 This brief examines the factors that most influenced consumer health plan selection among those with different types of coverage during the first enrollment period in the Affordable Care Act Health Insurance Marketplace. The brief is based on data from the Center for Healthcare Research & Transformation’s 2014


 One in five Michigan residents report having been diagnosed with depression at some point in their lives. Mental health disorders cause more disability among Americans than any other illness group.
 Understanding the impact of health care coverage (or the lack of it) on health care access is crucial to improving health care in Michigan.