Publications

New CHRT survey analyzes who in Michigan isn’t getting vaccinated against COVID-19 and why with policy, practice recommendations

Who isn’t getting vaccinated against COVID-19 and why?Between March 19, 2021 and April 1, 2021, CHRT fielded a supplement to its regular Cover Michigan Survey—a representative survey of Michigan adults—to better understand who isn’t getting vaccinated against COVID-19 and the reasons for their vaccine hesitancy, delay, and avoidance.

Who isn’t getting vaccinated against COVID-19?

  • Only 20 percent of Latinx/Hispanic residents reported having received at least one dose of vaccine. 
  • Only 24 percent of those making less than $30,000 per year had received at least one dose of vaccine (compared to 42 percent of those who reported incomes of $100,000 or more). 
  • Respondents without health insurance were three times less likely to have received at least one dose of vaccine (11%) than those who were insured (34%). 
  • Respondents without a medical home were less likely to have received at least one dose of vaccine (25%) compared to those with an established health care provider (35%).

For those unsure or not intending to get vaccinated, what are the reasons behind their hesitancy or resistance?

  • Most of those who did not intend to get vaccinated were worried about side effects (86%). This was followed by concerns that the vaccine was too new (83%) and a mistrust of government to ensure the safety of the vaccine (78%). Other reasons included a belief that the effects of COVID-19 have been exaggerated or that they were not at risk for infection. 
  • There are differences in why people are hesitant—white respondents were more likely to cite reasons that down-played the risk of COVID-19, while Black and Latinx/Hispanic respondents were more likely to cite concerns about the vaccine itself.
  • Black respondents were less likely to be resistant to getting vaccinated—28 percent of white respondents and 27 percent of Latinx/Hispanic respondents did not intend to get vaccinated, compared to only 11 percent of Black respondents. 
  • Black respondents were more likely, however, to be unsure about getting vaccinated—29 percent reported that they were unsure whether they would get vaccinated, compared to 20 percent of Latinx/Hispanic and 13 percent of white respondents.

As we better understand who in Michigan isn’t getting vaccinated against COVID-19 and why, our brief offers recommendations for where the state should go from here—including the use of trusted messengers, addressing concerns raised by communities of color, and conducting more community outreach.

READ THE BRIEF

Access to health care in Michigan: Results from CHRT’s latest Cover Michigan Survey

A physician high-fives a child who is sitting on his father's lap. The father is an example of the Michigan residents the 2018 Cover Michigan Survey speaks with.The Center for Health and Research Transformation’s (CHRT) 2018 Cover Michigan Survey asked Michigan residents about their experiences in accessing health care, specifically how easy or difficult it was to get appointments with different providers.

The Cover Michigan Survey found that two factors—the presence of primary care providers (PCP), and whether or not people had a medical home—figured prominently in reported ease of access to care.

Additionally, ease of access to health care can vary and is not uniform for all populations. Over time, the percentage of respondents reporting ease of access or access challenges has been relatively consistent, but uninsured people continue to face challenges in accessing care, and access to some critical services like specialty and mental health care continues to be a problem for key groups. The 2018 Cover Michigan Survey report examines important indicators of access: self-reported ease of accessing primary, specialty, mental health, and dental care, and forgoing necessary medical and mental health care.

People in Michigan have varying experiences in accessing care. The 2018 Cover Michigan Survey
examined those variations by a number of factors and found important disparities. Key findings
include:

  • Variations in access to care exist: Primary and dental care were the least difficult services to access while specialty and mental health care were reported to be the most difficult. One in five people reported not seeking necessary medical care in the last six
    months and one in ten reported not seeking necessary mental health care in the last year.
  • Connection to primary care matters: In comparison to Michiganders who had a PCP, people without a PCP were more likely to forgo medical and mental health care, and report difficulty accessing all types of care. Nearly half of those without a PCP had difficulty accessing specialty care and mental health care.
  • Having a medical home matters: People who relied on hospital ER/urgent care and clinic settings as their routine location of care reported more difficulty accessing care, and were more likely to report forgoing medical and mental health care, in comparison to those whose usual source of care was at a doctor’s office. The largest gaps were seen in mental health care, with hospital ER/urgent care and clinic users being twice as likely to report difficulty accessing care compared to people who typically access care through a doctor’s office.
  • Differences in access by type of insurance are evident: People with Medicaid and individually purchased plans were more likely to report difficulty accessing specialty and dental care, in comparison to those with Medicare or employer-sponsored plans. However, Medicaid beneficiaries were least likely to report difficulty in accessing mental health care. People who remain uninsured reported the greatest difficulty accessing all types of care, and were also most likely to report forgoing medical and mental health care they believed they needed.

READ THE REPORT

Cover Michigan Survey: Use of Health Care Benefits in Michigan

Data from the Center for Health and Research Transformation’s (CHRT) 2018 Cover Michigan Survey show health benefits that Michiganders with health insurance coverage have used in the past year (1)Survey participants were asked whether or not they or other family members covered by their plans used each health care benefit in the past 12 months.. Detail on the Cover Michigan Survey and analysis methodology can be found on CHRT’s website. In addition to findings on overall use of health care benefits, this brief focuses on three key areas: dental and vision, reproductive health, and mental health care.

Nearly all Michiganders used some kind of health benefit over the last year. To understand differences in the use of health care benefits, several variables were examined by demographics including gender, age, race, insurance type, income, and employment status.

  • Preventive care: The highest utilized benefit was routine, preventive primary care This was consistent across all groups.
  • Dental and vision care: There is high use of these benefits even though they are not generally core offerings of most insurance
  • Reproductive health care: Michigan women, especially younger women, use these health benefits at a significantly higher rate than men and older women. Reproductive health care represents 11 percent of younger women’s health care utilization.
  • Mental health care: Younger women and people who are unemployed reported significantly higher use of their mental health care or substance use treatment coverage.

Other findings include:

  • Aside from dental and inpatient care, women consistently utilized more health care benefits than men.
  • African Americans were the least likely to visit a doctor and use vision care benefits compared to other races, while white Michiganders were the most likely to use inpatient services.
  • Regardless of insurance type, respondents use doctor visits at similar rates, however those with employer-provided insurance were the most likely to use dental care health benefits.
  • Medicaid beneficiaries had the highest utilization of pediatric care, contraceptive/family planning, mental health/substance use, and maternity/newborn care benefits; and Medicare beneficiaries made the most use of the prescription drug benefit. These differences are likely due to the unique populations that make up membership in these plans.
  • Compared to those with lower household income, Michiganders with incomes of $50,000 or more per year were far more likely to use dental care, doctor visits, and vision benefits.
  • The unemployed population was more likely to use inpatient care, mental health/substance abuse services, and maternity/newborn care than those who are working or in school.

READ THE REPORT

References

References
1 Survey participants were asked whether or not they or other family members covered by their plans used each health care benefit in the past 12 months.

Quick Facts: Chronic Pain in Michigan

Pill bottle and red and orange pills over a sheet reading "Chronic pain".

Not everyone suffers from chronic pain in Michigan, but many people do. Our Cover Michigan Survey found that more than 35 percent of the state’s residents say they experienced chronic pain which limited their lives or work within the last year. This is similar result to research finding at least 30% of Americans report suffering from chronic pain.

These infographics from the Center for Health and Research Transformation are based on consumer response, and show how many people report suffering from chronic pain, along with who is most affected.
 
Some of the key information includes:
  • One in three people reported pain that limited their lives or work in the past year, and one in five were prescribed a pain medication.
  • Of those suffering pain in the past year, four in five people had chronic pain some or most days.
  • Chronic pain affects adults of all ages.
  • Women and men experience chronic pain equally.
  • African Americans were significantly more likely to suffer from chronic pain compared with all other groups.
  • Medicaid beneficiaries report chronic pain at a higher rate than adults with other kinds of insurance.
In the context of the opioid epidemic and the utilization of prescription pain medication, these findings demonstrate the need for providers to remain vigilant and become well-versed in alternative treatments for chronic pain.
 

Michigander’s satisfaction with health care coverage has increased since ACA implementation

Two small blocks, one with a smiley face drawn in black and one with a frown face. A hand is moving the smiling block forward to show how health care satisfaction has increased since the implementation of the ACA.Data from the Center for Healthcare Research and Transformation’s (CHRT) Cover Michigan Survey describes the rate of satisfaction with health care coverage before and after implementation of the Patient Protection and Affordable Care Act (ACA).

Satisfaction with health care coverage in the state of Michigan has increased since the implementation of the ACA. In 2015, 57 percent of Michiganders reported that they were satisfied with their health coverage, which is in alignment with national rates of satisfaction with health care. This represents a significant increase from the 51 percent of respondents who reported they were satisfied with their health care coverage in 2012 before the ACA took effect. In 2014, 52% of Michigan residents reported that they were satisfied with their health care coverage.

The Cover Michigan Survey data presented in this brief were produced from a series of survey questions added to the Michigan State University Institute for Public Policy and Social Research quarterly State of the State Survey. Further methodology detail can be found on CHRT’s website. In 2015, the survey was fielded between October and December 2015 and included a sample of 972 Michigan adults, with a 17.0 percent response rate. In 2014, the survey was fielded between September and November 2014 and included a sample of 1,002 Michigan adults with a 20.2 percent response rate. In 2012, the survey was fielded between August and October 2012 and included a sample of 1,018 Michigan adults, with a 31.6 percent response rate.

READ THE BRIEF


Insurance Churning

White and blue churning waterThe uninsured rate has declined substantially since provisions of the Patient Protection and Affordable Care Act (ACA) came into effect. Nevertheless, many individuals continue to experience instability in insurance coverage. Transitions between different insurance plans, as well as between insured and uninsured status, are often referred to as “insurance churning.”

The causes of insurance churning vary. Changes in job status may result in loss of coverage or transition to a new insurance plan. Eligibility for Medicaid or plans with Marketplace subsidies may change based on changes in family composition or fluctuations in income. Nationally, three to five percent of members are dropped each month by health plans offered on the Health Insurance Exchange due to non-payment of premiums.

Insurance churning can affect quality, cost, and continuity of care. Individuals may avoid seeking health care when they need it during gaps in insurance coverage. Even if consumers maintain continuous coverage while transitioning between different insurance plans, they may find that their regular health care providers do not accept their new insurance plan. In addition, when they change health plans, research shows that medication compliance is often disrupted. These and other churning-related problems tend to be exacerbated by uncertainty about what new co-pays or deductibles might be as well as by known increased costs associated with new insurance plans.

A recent study found no evidence of significant increases or decreases in broader indicators of insurance churning since the introduction of the ACA in three states (Texas, Kentucky, and Arkansas). Under the new administration, depending on which provisions of the ACA are repealed, replaced, defunded, or retained in the coming years and how these changes are implemented, rates of insurance churning could change dramatically.

Between 2013 and 2015, data from the Census Bureau show that the proportion of Michiganders who reported no source of health insurance declined by five percentage points—from 11 percent to 6 percent. Using data from the Center for Health and Research Transformation’s Cover Michigan Survey, this brief explores consumer experiences with insurance churning and access to care within the state of Michigan for approximately a one-year period in 2014–2015.

Key findings include:

  • Medicaid recipients had the most instability in their coverage status of all respondents to the survey. Medicaid recipients were also seven times more likely to have experienced a temporary uninsured period in the past year compared to respondents with employer-sponsored or individual coverage.
  • Those with individually purchased coverage in 2014 were the most likely to switch to a different type of coverage in 2015. Among respondents with an individually purchased plan in 2014, less than half reenrolled in the same plan in 2015, and nearly a third transitioned to Medicare or to an employer-sponsored plan in 2015.
  • Those with employer-sponsored coverage experienced the least amount of churning compared to respondents with other coverage. Ninety-four percent of respondents with employer-sponsored coverage remained continuously insured from 2014 to 2015.

READ THE REPORT

Wellness program participation

A person sits at a computer. The screen shows a wellness program enrollment page.This brief examines the characteristics of Michigan residents who reported being invited to participate in wellness programs and their perceptions of these programs. The brief is based on data from the Center for Healthcare Research & Transformation’s (CHRT) 2015 Cover Michigan Survey of Michigan adults, fielded between October and December 2015.

Wellness programs have grown increasingly common in recent years. A Kaiser Family Foundation study found that 63 percent of organizations that employed and provided insurance for at least three employees offered some form of wellness program. Larger employers were more likely to offer their own wellness program and smaller employers were more likely to offer a program through their employees’ insurer.

Despite their increasing prevalence, evidence on the effectiveness of wellness programs is mixed, and the Rand Corporation has estimated that only 20–40 percent of eligible employees participate in wellness programs.

Key findings from our Cover Michigan Survey include:

A substantial share of Michiganders reported having participated in wellness programs, but they perceived limited benefits from these programs. Respondents reported participating in programs focused on mental health or stress management relatively infrequently, but those who participated in such programs reported the greatest perceived benefits.

  • One in five respondents (20 percent) reported having participated in a wellness program sponsored by their employer, insurer, or another organization within the year prior to the survey.
  • Wellness programs were most likely to focus on increased exercise, healthy eating, or preventive care. Eighty-two percent of those who participated in a wellness program reported that it emphasized exercise, 76 percent reported that it emphasized healthy eating, and 76 percent reported that it emphasized preventive care.
  • Only 27 percent of respondents who participated in a wellness program found the program to be “very helpful.”
  • Respondents who participated in a wellness program focused on mental health or stress management were most likely to report that they had found the wellness program “very helpful.” Forty percent of those who participated in programs focused on mental health or stress management reported that the program had been “very helpful” compared to only 23 percent of those who participated in programs focused on other topics.

READ THE BRIEF

Cover Michigan Survey: The Uninsured in Michigan

Medical symbols in blue with "Affordable Care Act" written in the center.

This brief examines the characteristics of those in Michigan who reported being uninsured, approximately two years after the ACA’s major coverage provisions went into effect beginning in 2014.

A major goal of the Affordable Care Act was to reduce the number of Americans who are uninsured. The main provisions of the law that were intended to help achieve that reduction include: 1) the individual mandate, 2) the expansion of Medicaid, 3) the creation of the health insurance marketplaces and the introduction of subsidies for individuals purchasing coverage, 4) the extension of coverage to adult children up to age 26, and 5) requirements that certain employers offer affordable health insurance coverage or pay a penalty.

Requirements that insurers cover those with preexisting conditions and prohibitions on rescission of coverage were also intended to further expand the number of Americans with access to affordable coverage. Because of these policies, estimates show that 16 million Americans gained insurance between 2010 and 2015. Nevertheless, an estimated 29 million Americans remained uninsured in 2015.

Our study of the uninsured in Michigan in 2014 and 2015 is based on data from the Center for Healthcare Research & Transformation’s (CHRT) 2015 Cover Michigan Survey of Michigan adults, fielded between October and December 2015. Comparison data is drawn from the 2009, 2011, 2012, and 2014 Cover Michigan Surveys.

Key findings include:

Since 2009, Michigan’s uninsured rate has declined dramatically. Specifically:

  • 5 percent of respondents reported being uninsured at the time of the survey. By comparison, in 2012, 14 percent of respondents reported being uninsured.
  • More than twice as many respondents reported having been uninsured at some point during the year before the survey than were uninsured at the time of the survey, indicating that many of the uninsured gained or regained coverage relatively quickly.
  • 41 percent of the uninsured reported annual household incomes below $30,000, and 54 percent reported incomes between $30,000 and $59,999.
  • Half of uninsured respondents worked full time.
  • 64 percent of the uninsured were male.
  • 39 percent of uninsured respondents were between the ages of 18 and 30.
  • Half of uninsured respondents lived in small cities or towns.

READ THE REPORT

Cover Michigan 2014 Survey: Satisfaction with Health Coverage in Michigan

Michigan doctor selecting a rating out of five stars as on a survey.The third open enrollment period for individual coverage on Michigan’s health insurance marketplace began on November 1, 2015, and will continue until January 31, 2016.(1)U.S. Centers for Medicare & Medicaid Services. November 2015. 2016 health insurance dates and deadlines.https://www.healthcare.gov/quick-guide/dates-and-deadlines/ (accessed 11/4/15) The average Michigan consumer will have 64 plans to choose from during the 2015 open enrollment period.(2)J. Fangmeier, 2015 Marketplace Rate Analysis (Ann Arbor, MI: Center for Healthcare Research & Transformation, Nov. 2015). Nationwide, 31 percent of consumers with marketplace coverage in both 2014 and 2015 switched plans during last year’s open enrollment period(3) T. DeLeire and C. Marks. Department of Health & Human Services. October 2015. Consumer Decisions Regarding Health Plan Choices in the 2014 and 2015 Marketplaces. http://aspe.hhs.gov/sites/default/files/pdf/134556/Consumer_decisions_10282015.pdf (accessed 11/4/15).

This brief examines how factors influencing health plan selection, both on and off the marketplace, were related to consumer satisfaction with insurance coverage. Our analyses suggest that when selecting a health plan during open enrollment, consumers may be happier with their coverage if they ensure that their plan includes their current primary care provider rather than looking for the plan with the widest network. Comparison shopping among plans at similar price points and looking for value instead of price alone may also lead to increased health plan satisfaction.

The brief is based on data from the Center for Healthcare Research & Transformation’s 2014 Cover Michigan Survey of Michigan adults, fielded between September and November 2014. Detailed methodology is available at https://chrt.org/publication/health-plan-selection-factors-influencing-michiganders-choice-of-health-insurance/.

Key findings include:

  • Consumers for whom price played a major role when selecting a health plan were less likely to be satisfied with their plans than those for whom price was a less important consideration.
  • Consumers whose insurance did not include their primary care provider were far less likely to be satisfied with their coverage than those whose providers were included in their plans.

Findings from the 2014 Cover Michigan Survey

Forty-nine percent of respondents who reported that premium costs were a very important consideration when selecting a health insurance plan were satisfied with their plan (defined as having rated it as ‘excellent’ or ‘very good’), compared to 61 percent of respondents for whom premium costs were not such an important consideration. Similar differences existed for those who reported that deductible, copay, and coinsurance costs had been very important considerations in their selection of a plan, but respondents for whom the number of physicians in the plan had been a very important consideration were equally likely to report being satisfied with their coverage as those for whom this had not been as important factor FIGURE 1.

Figure 1: Percent of respondents satisfied with coverage, by importance of cost and network size in plan selection

Figure1

Source: CHRT Cover Michigan Survey 2014.

Only 21 percent of respondents who reported having had to change health care providers in the previous year because their provider was not included in their plan were satisfied with their coverage, compared to 54 percent of respondents whose insurance did not cause them to switch providers FIGURE 2.

Figure 2: Satisfaction with coverage, by insurance inclusion of provider
Figure2

Source: CHRT Cover Michigan Survey 2014.

READ THE BRIEF

References

References
1 U.S. Centers for Medicare & Medicaid Services. November 2015. 2016 health insurance dates and deadlines.https://www.healthcare.gov/quick-guide/dates-and-deadlines/ (accessed 11/4/15)
2 J. Fangmeier, 2015 Marketplace Rate Analysis (Ann Arbor, MI: Center for Healthcare Research & Transformation, Nov. 2015).
3 T. DeLeire and C. Marks. Department of Health & Human Services. October 2015. Consumer Decisions Regarding Health Plan Choices in the 2014 and 2015 Marketplaces. http://aspe.hhs.gov/sites/default/files/pdf/134556/Consumer_decisions_10282015.pdf (accessed 11/4/15).

Flu Vaccination in Michigan: Opportunities for Improvement

Person receiving a flu vaccination.Introduction

Approximately 6,000 Americans die of influenza every year,(1)Centers for Disease Control and Prevention, “Estimates of Deaths Associated with Seasonal Influenza — United States, 1976–2007,” Morbidity and Mortality Weekly Report (MMWR), Aug. 27, 2010, 59(33): 1057–62: http://www.cdc.gov/mmwr/preview/mmwrhtml/mm5933a1.htm (accessed 6/25/15) and almost 800 people were hospitalized during the 2014–2015 flu season in the four Michigan counties that report flu hospitalizations (Clinton, Eaton, Genesee, and Ingham counties).(2)Michigan Department of Health & Human Services, “Influenza Surveillance Report for the Week Ending June 13, 2015,” MI Flu Focus, Influenza Surveillance Updates, (Lansing, MI: Michigan Department of Health & Human Services, Bureaus of Epidemiology and Laboratories, June 24, 2015), 12(23): http://www.michigan.gov/documents/mdch/MIFF_6-24-15_492747_7.pdf (accessed 6/25/15). Although the Centers for Disease Control and Prevention (CDC) Advisory Committee on Immunization Practices recommends that all adults and children over the age of six months receive an annual flu vaccination,(3)Centers for Disease Control and Prevention, Advisory Committee on Immunization Practices (ACIP) Reaffirms Recommendation for Annual Influenza Vaccination (Atlanta, GA: CDC, Feb. 26, 2015): http://www.cdc.gov/media/releases/2015/s0226-acip.html (accessed 6/25/15). only 42 percent of American adults were vaccinated against the flu during the 2013–2014 flu season.(4)Centers for Disease Control and Prevention, Flu Vaccination Coverage, United States, 2013–14 Influenza Season (Atlanta, GA: CDC, September 14, 2014): http://www.cdc.gov/flu/fluvaxview/coverage-1314estimates.htm (accessed 9/1/15). Michigan’s vaccination rate during the 2013–2014 flu season was slightly lower than the national average at 40 percent.(5)Centers for Disease Control and Prevention, 2013–14 State, Regional, and National Vaccination Report II (Atlanta, GA: CDC, N.D.): http://www.cdc.gov/flu/fluvaxview/reportshtml/reporti1314/reportii/index.html (accessed 9/1/15). Effectiveness of the flu vaccine varies greatly from year to year based on the annual vaccine’s match with strains of flu virus circulating at the time as well as other factors. Nevertheless, even the 2014–2015 vaccine, which was not as well matched to the predominant strains during that season as some previous vaccines, was able to reduce the odds of influenza infection by almost one-fourth among those vaccinated in the United States.(6)Centers for Disease Control and Prevention, “Early Estimates of Seasonal Influenza Vaccination Effectiveness—United States, January 2015,” Morbidity and Mortality Weekly Report (MMWR), Jan. 16, 2015, 64(01): 10–15: http://www.cdc.gov/mmwr/preview/mmwrhtml/mm6401a4.htm (accessed 6/25/15).

Michiganders insured through Medicaid or the Healthy Michigan Plan (the state’s expanded Medicaid program) are able to receive annual flu vaccination without a copay.(7)Michigan Department of Community Health, MSA Bulletin 10-30 (Lansing, MI: Michigan Department of Community Health, Medical Services Administration, Aug. 10, 2010): https://michigan.fhsc.com/Downloads/ MSA_10-30_330003_7.pdf (accessed 8/20/15). The Healthy Michigan Plan encourages beneficiaries to choose vaccination by reducing annual out-of-pocket contributions by 50 percent for those with an annual household income above the federal poverty level who complete a Health Risk Assessment with their primary care office/clinic and identify a health behavior goal such as receiving a flu shot.(8)State of Michigan, Healthy Michigan Plan, MI Health Account (Lansing, MI: Healthy Michigan Plan, 2015): http://www.michigan.gov/healthymiplan/0,5668,7-326-67957_69564—,00.html (accessed 8/20/15). Because Healthy Michigan Plan beneficiaries whose income is below the federal poverty level are not required to make out-ofpocket contributions, many plans instead provide them with a $50 prepaid card or gift card for completing the Health Risk Assessment.(9)U nitedHealthcare, Healthy Michigan Plan – Health Risk Assessment
Provider FAQ’s (Southfield, MI: United Healthcare, April 2014): http://www.uhccommunityplan.com/content/dam/communityplan/healthcareprofessionals/providerinformation/MI-Provider-Information/MI_Healthy_Incentive_FAQ.pdf (accessed 8/20/15).
,(10)HealthPlus Partners Healthy Michigan, HealthPlus Partners will reward you for taking steps toward getting and staying healthy! (N.P.: HealthPlus, April 8, 2014): https://www.healthplus.org/uploadedFiles/PDFs/Healthy_Michigan/HMP%20HRA%20Member%20Incentives%20Letter%20050514.pdf (accessed 8/20/15). As one of the Affordable Care Act’s preventive health services, annual flu vaccinations are also available without a copay or deductible to many Michiganders with private insurance.(11)U .S. Centers for Medicare & Medicaid Services, Preventive Health Services for Adults (Baltimore, MD: U.S. Centers for Medicare and Medicaid Services, N.D.): https://www.healthcare.gov/preventive-care-benefits/ (accessed 6/25/15). This brief examines the factors affecting flu vaccination in Michigan and how current and future policy initiatives could improve vaccination rates.

The brief is based on data from the Center for Healthcare Research & Transformation’s 2014 Cover Michigan Survey of Michigan adults, fielded between September and November 2014. All reported differences are statistically significant at the p ≤ 0.05 level.

Key Findings

  • Less than half (45 percent) of Michigan adults surveyed reported having received a flu vaccination in the past 12 months, a proportion similar to the national average.
  • Only 37 percent of African-American respondents reported having been vaccinated against the flu in the 12 months prior to the survey, compared to 47 percent of white respondents.
  • Women were more likely than men to report having received the flu vaccine: 48 percent of women reported having been vaccinated as compared to only 42 percent of men.
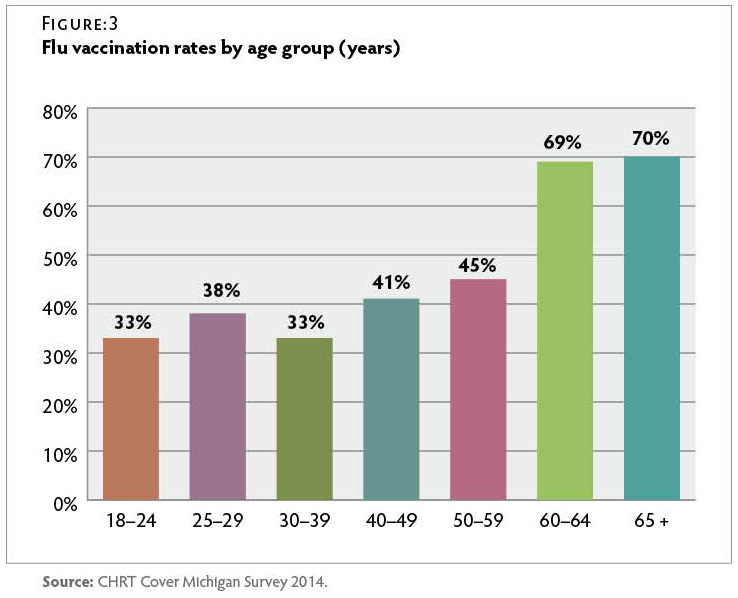
  • About one in three respondents under the age of 40 (34 percent) reported having been vaccinated, compared to more than two-thirds (70 percent) of those over 65.
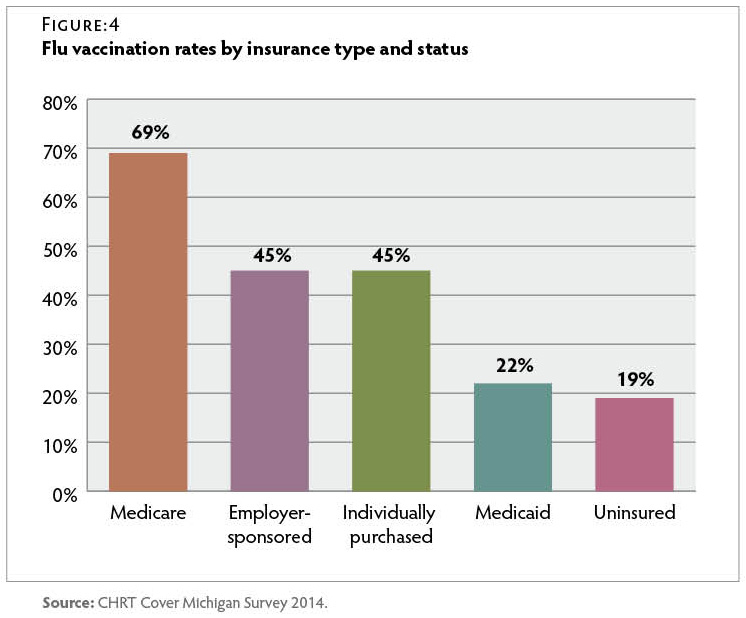
  • Only 22 percent of respondents with Medicaid and 19 percent of uninsured respondents reported having received the flu vaccine in the past 12 months, about half the rate of respondents with employer-sponsored or individually purchased insurance.
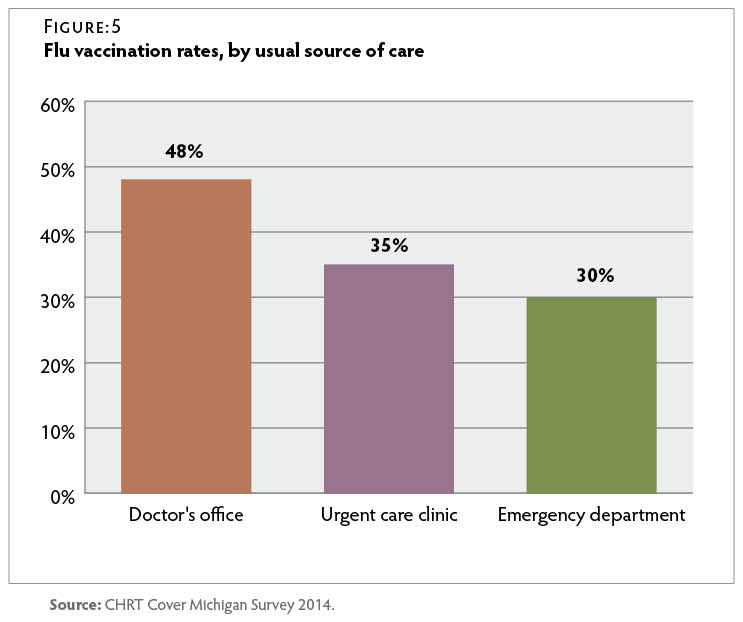
  • Forty-eight percent of respondents who usually sought care at a doctor’s office reported having been vaccinated, compared to only 35 percent of those whose usual source of care was an urgent care clinic and 30 percent of those whose usual source of care was an emergency department.

    Demographic Predictors of Vaccination

Forty-five percent of Michigan residents surveyed reported having received a flu vaccination in the 12 months before the survey. Forty-seven percent of white respondents reported having been vaccinated in the year leading up to the survey, compared to only 37 percent of African-American respondents.

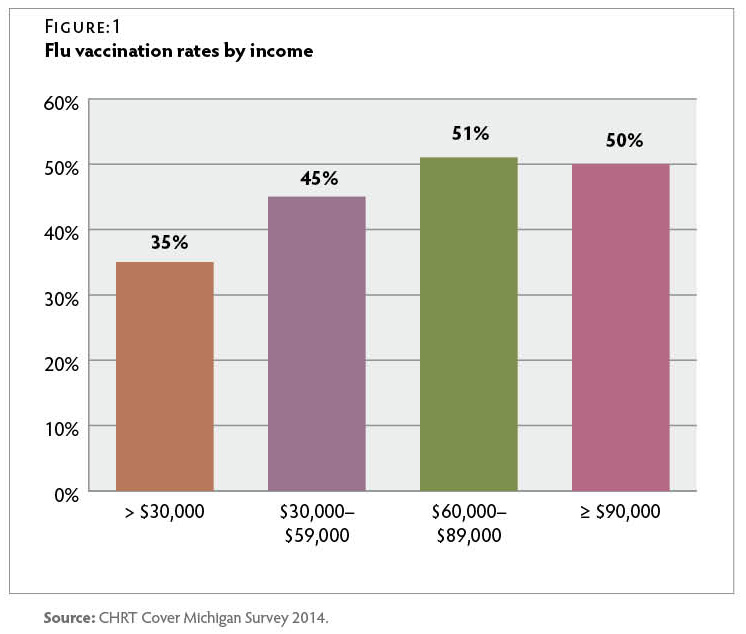
Only one-third of those whose income was less than $30,000 had been vaccinated, compared to half of those with an income above $30,000. Figure 1

CT958-CMS-Influenza-FIG1

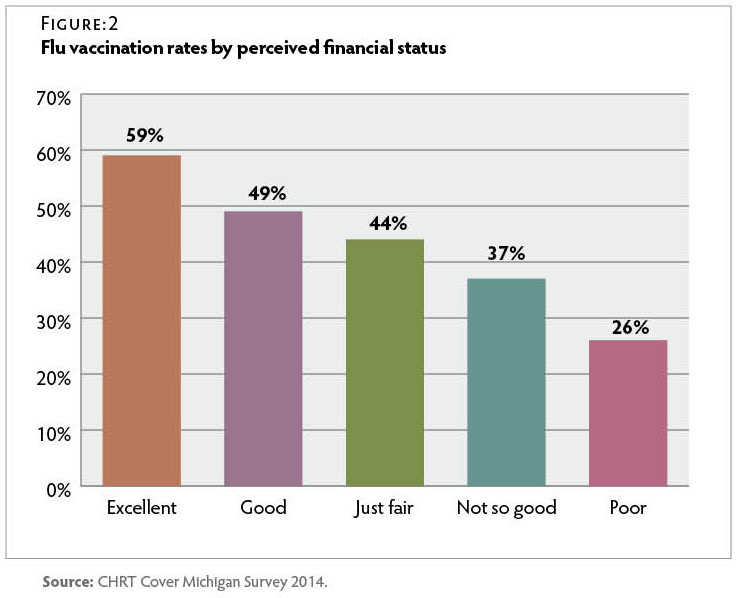
Perceived household financial status had an even stronger relationship with flu vaccination than did reported household income. Those who rated their household financial status as “excellent” were more than twice as likely to report having received a flu shot than were those who rated their household financial status as “poor.” Figure 2

CT958-CMS-Influenza-vFIG2

Michiganders over the age of 65 were twice as likely to report having received a flu vaccine as those under 40. Only 34 percent of those between the ages of 18 and 39 reported having been vaccinated in the past year. Figure 3

CT958-CMS-Influenza-vFIG3


Insurance Status and Vaccination

Survey respondents reported wide variations in vaccination rates varied based on insurance status. Only 19 percent of uninsured respondents reported that they had been vaccinated in the past year, compared to 48 percent of insured respondents. Michiganders with Medicare were most likely to report having received the flu vaccine, while those who were uninsured or had Medicaid were least likely to report having been vaccinated. Respondents with employer-sponsored or individually purchased insurance were almost twice as likely as those with Medicaid to report having received a flu vaccine. Less than one-quarter of respondents with Medicaid reported having been vaccinated in the 12 months prior to the survey. Figure 4

CT958-CMS-Influenza-FIG4


Source of Care and Vaccination

Half of Michiganders who reported that they had a primary care provider received a flu vaccine, compared to only 28 percent of respondents who did not have a primary care provider. Those who reported that they usually went to a doctor’s office when they were sick or needed medical advice were more likely to have been vaccinated than those who reported usually receiving care at an emergency department or urgent care clinic. Figure 5

CT958-CMS-Influenza-FIG5


Conclusion

Despite recommendations that all individuals six months and older be vaccinated against the flu each year, less than half of Michigan adults surveyed reported having been vaccinated in the year leading up to this survey. Michigan residents whose income was less than $30,000 per year, those without a primary care provider and/or who relied on urgent care facilities or emergency departments for care, and those who had Medicaid or were uninsured were least likely to have been vaccinated. The low vaccination rates among these groups suggest a need for targeted future interventions. These data were collected too early in 2014 to fully reflect vaccination rates during the 2014–2015 flu season and therefore do not assess effectiveness of the Healthy Michigan Plan’s potential to effect changes in vaccination rates. It is possible that Michigan vaccination rates may increase as more Michiganders gain insurance coverage through the Medicaid expansion and the insurance marketplace, and as participation in the Healthy Michigan Plan’s incentive program expands.

Methodology

The survey data presented in this brief were produced from a series of survey questions added to the Michigan State University Institute for Public Policy and Social Research (IPPSR) quarterly State of the State Survey. The survey was fielded between September and November 2014 and included a sample of 1,002 Michigan adults, with a 20.2 percent response rate. The margin of error for the entire sample was ±3.9 percent. The sampling design, a random stratified sample based on regions within the state, was a telephone survey of Michigan residents conducted via landline and cellular phones.

For analytical purposes, survey data were weighted to adjust for the unequal probabilities of selection for each stratum of the survey sample (for example, region of the state, listed vs. unlisted telephones). Additionally, data were weighted to adjust for non-response based on age, gender, and race according to population distributions from 2009–2013 American Community Survey data. Respondents who reported both Medicare and Medicaid coverage or who reported coverage through the Healthy Michigan Plan were considered Medicaid recipients for the purpose of this analysis. Due to the timing of the survey, reported vaccination may have occurred during either the 2013–2014 flu season or during the 2014–2015 flu season. Results were analyzed using SAS 9.3 software. Statistical significance of bivariate relationships was tested using z tests or chi-square tests for independence. All comparison tables are statistically significant at the p ≤ 0.05 level unless otherwise noted. A full report of the IPPSR State of the State Survey methodology can be found at: http://ippsr.msu.edu/soss/.

READ THE REPORT


Suggested Citation: Mary L. Smiley, Melissa Riba, and Marianne Udow-Phillips, Flu Vaccination in Michigan:
Opportunities for Improvement. Cover Michigan Survey 2014 (Ann Arbor, MI: Center for Healthcare Research & Transformation, October 2015).

Acknowledgements: The staff at the Center for Healthcare Research & Transformation would like to thank Thomas Buchmueller, Matthew M. Davis, Robert Goodman, Helen Levy, Renuka Tipirneni, and the staff of the Institute for Public Policy and Social Research (IPPSR) at Michigan State University for their assistance with the design and analysis of the survey.

References

References
1 Centers for Disease Control and Prevention, “Estimates of Deaths Associated with Seasonal Influenza — United States, 1976–2007,” Morbidity and Mortality Weekly Report (MMWR), Aug. 27, 2010, 59(33): 1057–62: http://www.cdc.gov/mmwr/preview/mmwrhtml/mm5933a1.htm (accessed 6/25/15)
2 Michigan Department of Health & Human Services, “Influenza Surveillance Report for the Week Ending June 13, 2015,” MI Flu Focus, Influenza Surveillance Updates, (Lansing, MI: Michigan Department of Health & Human Services, Bureaus of Epidemiology and Laboratories, June 24, 2015), 12(23): http://www.michigan.gov/documents/mdch/MIFF_6-24-15_492747_7.pdf (accessed 6/25/15).
3 Centers for Disease Control and Prevention, Advisory Committee on Immunization Practices (ACIP) Reaffirms Recommendation for Annual Influenza Vaccination (Atlanta, GA: CDC, Feb. 26, 2015): http://www.cdc.gov/media/releases/2015/s0226-acip.html (accessed 6/25/15).
4 Centers for Disease Control and Prevention, Flu Vaccination Coverage, United States, 2013–14 Influenza Season (Atlanta, GA: CDC, September 14, 2014): http://www.cdc.gov/flu/fluvaxview/coverage-1314estimates.htm (accessed 9/1/15).
5 Centers for Disease Control and Prevention, 2013–14 State, Regional, and National Vaccination Report II (Atlanta, GA: CDC, N.D.): http://www.cdc.gov/flu/fluvaxview/reportshtml/reporti1314/reportii/index.html (accessed 9/1/15).
6 Centers for Disease Control and Prevention, “Early Estimates of Seasonal Influenza Vaccination Effectiveness—United States, January 2015,” Morbidity and Mortality Weekly Report (MMWR), Jan. 16, 2015, 64(01): 10–15: http://www.cdc.gov/mmwr/preview/mmwrhtml/mm6401a4.htm (accessed 6/25/15).
7 Michigan Department of Community Health, MSA Bulletin 10-30 (Lansing, MI: Michigan Department of Community Health, Medical Services Administration, Aug. 10, 2010): https://michigan.fhsc.com/Downloads/ MSA_10-30_330003_7.pdf (accessed 8/20/15).
8 State of Michigan, Healthy Michigan Plan, MI Health Account (Lansing, MI: Healthy Michigan Plan, 2015): http://www.michigan.gov/healthymiplan/0,5668,7-326-67957_69564—,00.html (accessed 8/20/15).
9 U nitedHealthcare, Healthy Michigan Plan – Health Risk Assessment
Provider FAQ’s (Southfield, MI: United Healthcare, April 2014): http://www.uhccommunityplan.com/content/dam/communityplan/healthcareprofessionals/providerinformation/MI-Provider-Information/MI_Healthy_Incentive_FAQ.pdf (accessed 8/20/15).
10 HealthPlus Partners Healthy Michigan, HealthPlus Partners will reward you for taking steps toward getting and staying healthy! (N.P.: HealthPlus, April 8, 2014): https://www.healthplus.org/uploadedFiles/PDFs/Healthy_Michigan/HMP%20HRA%20Member%20Incentives%20Letter%20050514.pdf (accessed 8/20/15).
11 U .S. Centers for Medicare & Medicaid Services, Preventive Health Services for Adults (Baltimore, MD: U.S. Centers for Medicare and Medicaid Services, N.D.): https://www.healthcare.gov/preventive-care-benefits/ (accessed 6/25/15).