Publications

Des Jardins contributes book chapter about ACO history, payment and delivery models

Four healthcare professionals sit at a table looking over paperwork.In a new book chapter for Springer’s Handbook Integrated Care (2021), CHRT’s executive director, Terrisca Des Jardins, communicates the history of ACOs and how they are being studied not only for improving the U.S. healthcare system, but as a model for other countries.

The chapter, “Innovative Payment and Care Delivery Models: Accountable Care Organizations in the USA,” also includes future potential areas of consideration, such as the impact of COVID-19.

Accountable Care Organizations (ACOs) are “groups of doctors, hospitals, and other healthcare providers, who come together voluntarily to give coordinated high-quality care to their Medicare patients” (CMS 2015). They differ from Health Maintenance Organizations (HMOs) by allowing patients more free choice in choosing their providers, as well as participating in a particular ACO. They also focus more on patient-centered care—especially primary care—instead of strict control of access as a means of reducing utilization.

To qualify for shared savings, ACOs must meet quality standards across 23 measures, covering four domains: patient/caregiver experience, care coordination/patient safety, preventive health, and at-risk population. An ACO’s performance is captured through a mix of surveys, claims data, and other sources.

The Centers for Medicare and Medicaid Services (CMS) at HHS remains active in promoting new ACO approaches to achieve high quality care and cost savings. Preliminary results show that Medicare’s flagship ACO program generally has good quality of care and outcomes, as well as modest cost savings. However, it is still too early to judge complete success or failure based on financial or quality indicators.

In 2018, the Pathways to Success redesign accelerated the timeline for ACOs to assume greater financial risk. ACOs that accepted downside risk (reimbursing payers if spending exceeds a set benchmark) were more likely to achieve shared savings than those that only accepted upside risk (no penalty for spending exceeding a benchmark). This suggests that greater financial responsibility is associated with a stronger commitment in transforming health care. 

READ THE CHAPTER

Health Insurance Marketplace 2019: Rate Analysis

Financial Graph

A hand holds a pen over a colorful chart with a calculator nearby, indicating the rate analysis of the health insurance marketplace.The health insurance marketplaces created under the Affordable Care Act (ACA) have weathered several years of volatility and uncertainty. Following a tumultuous 2017 marked by Congressional “repeal and replace” debates, important administrative changes, and the termination of cost-sharing reduction payments to insurers, Michigan and other states experienced steep premium increases for 2018.

One year later, premiums in Michigan’s Health Insurance Marketplace have stabilized, with increases for 2019 far lower than they have been in recent years. Michigan also experienced its first new insurer entering the market since 2015.

With financial assistance tied to premium levels, low premium increases for 2019 mean that some individuals will experience changes in the amount of financial assistance they receive to purchase Marketplace coverage, so consumers should compare plan options, pricing, and benefits carefully to find coverage that meets their needs.

Key findings of our 2019 health insurance marketplace rate analysis include:

  • Premium increases for 2019 are substantially lower than premium increases in 2018. Across all counties, the average premium increase for the lowest cost and second-lowest cost silver plans is 0.6 percent and 1.5 percent, respectively. Premiums for the lowest cost bronze plan increased by 1.5 percent, and premiums for the lowest cost gold plan decreased by 0.2 percent.
  • Michigan continues to have a robust Marketplace. Nine insurers are participating in the health insurance marketplace in 2019, an increase of one from 2018. The new insurer, Oscar Insurance Company, offers coverage in five Southeast Michigan counties. All of Michigan’s 83 counties have at least two participating carriers.
  • Michigan consumers can select from a variety of Marketplace plans. There are 12 to 57 plans offered in each of Michigan’s 83 counties.
  • The 2019 Marketplace Open Enrollment Period remains the same length as it was for 2018: 45 days, beginning November 1 and ending December 15.
  • Federal financial support for Michigan Navigators to help with open enrollment has been reduced by 51 percent, from $627,958 in 2018 to $309,111 in 2019.
  • This is the second year in a row of substantial funding reductions for the Navigator program: from 2017 to 2018, Michigan’s Navigator funding decreased by 72 percent, from $2,228,692 in 2017 to $627,958 in 2018.

READ THE REPORT

Learning health for Michigan: The path forward

A physician in blue scrubs points at a screen with tiles showing health symbols, a representation of a health learning system.

A physician in blue scrubs points at a screen with tiles showing health symbols, a representation of a health learning system.In the United States, health care purchasers, consumers, and policymakers are demanding improvements in the quality and efficiency of medical care. A promising approach to meet this demand is the development of what is known as a learning health system (LHS). A learning health system has the capability to continuously study and improve itself. Among many types of benefits it can bring about, the learning health system makes it possible for providers to make faster and better decisions about which treatment options would produce the best outcomes for patients.

Today, the Michigan-based stakeholder initiative, Learning Health for Michigan (LH4M), is proposing the use of a learning health system approach to address persistent health care problems in Michigan. Unwarranted and costly hospital readmissions—which are discussed in this paper—are one example of a problem that could benefit from a learning health system approach.

In 2013, the Center for Healthcare Research and Transformation (CHRT) convened a group of patients, clinicians, researchers, public health professionals, and payers to discuss ways to apply the idea of the learning health system at a state level: to turn Michigan into what might be called a “learning health state.” The initiative was named “Learning Health for Michigan,” or LH4M. Later convenings of the LH4M stakeholder group were organized by the Michigan Health Information Network (MiHIN) Shared Services and the Department of Learning Health Sciences at the University of Michigan Medical School.

Michigan has many resources that are key ingredients for a state-wide learning health system.

READ THE BRIEF

Rising cost of specialty drugs in Michigan and the United States: A case example for Multiple Sclerosis

Test tubes, most filled with pills and one filled with money, indicating the rising cost of specialty drugs.

Test tubes, most filled with pills and one filled with money, indicating the rising cost of specialty drugs.Specialty drugs continue to be a growing component of the prescription drug market and the increase in their cost has fueled increases in overall prescription drug spending. These drugs are used to treat complex and chronic medical conditions such as cancer, hepatitis C, multiple sclerosis (MS), and rheumatoid arthritis. They typically require special handling, administration, and monitoring, adding to their cost.

Spending on non-specialty drugs has decreased in Michigan in recent years, yet total drug spending has increased because of increased spending on specialty drugs, especially with the release of new, high-cost MS and hepatitis C drugs. Treatments for these two conditions rely greatly on prescription drug medication that can save lives and improve patients’ quality of life. But, recent cost increases for drugs like these can often lead to high out-of-pocket costs. Generic drugs offer an alternative to costly branded drugs, with savings up to 80 percent for consumers. However, generics are not available for most specialty drugs.

The Rising Cost of Specialty Drugs in the United States examines overall specialty drug cost trends in the United States and Michigan, focusing on high-cost specialty drugs for MS patients, and explores policy implications. The analysis is based on prescription drug data for privately insured patients with prescription drug coverage. The Michigan data includes privately insured patients with prescription drug coverage through Blue Cross Blue Shield of Michigan (BCBSM). The national data is from Express Scripts Drug Trend Reports, 2011-2014, and is also limited to privately insured patients. Specialty drugs covered under a patient’s medical benefit are not included in this analysis (generally includes drugs administered in hospital or institutional settings).

Key findings include:

  • From 2011 to 2014, specialty drug spending increased substantially as a proportion of total drug spending, both in Michigan (from 14 percent to 22 percent) and the United States (from 18 percent to 32 percent).
  • While Michigan’s specialty drug costs did not grow as fast as the national average during this time period, Michigan spent more per member per year (PMPY) than the U.S. average in 2014 for seven of the top eight specialty drugs.
  • In Michigan, higher PMPY spending on specialty drugs used to treat multiple sclerosis (MS), including Copaxone and Tecfidera, is explained in part by the higher MS prevalence rates in Midwestern states(1)Regions in this brief used for MS prevalence data are defined by P. Dilokthornsakul et al.’s article, “Multiple sclerosis prevalence in the United States commercially insured population.” This definition was used as it provides the most current, region specific prevalence data available. MS prevalence data defines the following states as Midwestern states: North Dakota, South Dakota, Nebraska, Kansas, Minnesota, Iowa, Missouri, Wisconsin, Illinois, Michigan, Indiana, and Ohio., including Michigan, compared to the United States.
  • Specialty drug price increases are also a factor in the escalating overall cost increases. For example, annual per patient spending in the United States for Copaxone, an MS drug, grew five-fold from its introduction in the mid-1990s to 2013 ($12,000 to $60,000, respectively). Most recently, annual per patient spending reached nearly $90,000.

READ THE REPORT

References

References
1 Regions in this brief used for MS prevalence data are defined by P. Dilokthornsakul et al.’s article, “Multiple sclerosis prevalence in the United States commercially insured population.” This definition was used as it provides the most current, region specific prevalence data available. MS prevalence data defines the following states as Midwestern states: North Dakota, South Dakota, Nebraska, Kansas, Minnesota, Iowa, Missouri, Wisconsin, Illinois, Michigan, Indiana, and Ohio.

Health Insurance Marketplace in Michigan 2018: Rate Analysis

health

Screenshot of the healthcare.gov website, location of the Health Insurance Marketplace

In 2017, the federal government took several regulatory and administrative actions that affect the health insurance marketplaces created under the Affordable Care Act (ACA). At the same time that Congress considered legislative proposals to repeal and replace the ACA, the U.S. Department of Health and Human Services (HHS) promulgated new regulations that changed annual open enrollment dates and announced the end of cost-sharing reduction payments to insurers. These developments, in addition to several other factors, have impacted Marketplace carrier participation and plan pricing in Michigan. This brief analyzes the rates in the 2018 Health Insurance Marketplace in Michigan.

Key findings include:

  • Michigan continues to have a robust Marketplace. Eight insurers are participating in Michigan’s health insurance marketplace in 2018, a decrease of two insurers from 2017.
  • Michigan consumers can select from a variety of Marketplace plans. There are 12 to 52 plans offered in each of Michigan’s 83 counties.
  • Across all counties, the average premium increase for the lowest cost and second-lowest cost silver plans is 33 percent and 34 percent, respectively. Premiums for the lowest cost bronze plan increased by 16 percent, and premiums for the lowest cost gold plan increased by 6 percent.
  • Premium tax credits are linked to the cost of the local second-lowest cost silver plan. All else equal, individuals who are eligible for premium tax credits could receive a larger tax credit in 2018 due to premium increases for the second-lowest cost silver plan. In 23 counties, larger tax credit amounts will eliminate the cost difference between renewing the 2017 lowest cost silver plan and actively enrolling in the 2018 lowest cost silver plan.
  • The federal government reduced the open enrollment period to 45 days, from 92 days in 2017.
  • Federal financial support for Michigan Navigators to help with open enrollment has been reduced by 72 percent, from $2,228,692 in 2017 to $627,958 in 2018.

READ THE BRIEF

Revisioning the Care Delivery Team: The Role of CHWs within State Innovation Models

A community health worker hands pills to an elderly man eating breakfast.The Affordable Care Act (ACA) promoted the broader use of Community Health Workers (CHWs) through a number of initiatives designed to reward health outcomes and value rather than paying providers by volume. One prominent ACA initiative under the Center for Medicare and Medicaid Innovation (CMMI) was the State Innovation Model (SIM) grants to states to design and test new payment and care delivery models. While the political future of the ACA remains uncertain, states continue to use their previously awarded SIM grants to experiment with how Community Health Workers can improve health care outcomes and lower the cost of care.

Community Health Workers (CHWs) have the potential to reduce health care costs and improve health care access, particularly for people with complex human service needs. As trusted members of the communities they serve, they help create bridges between patients and health systems to better meet patients’ needs. CHWs have been studied since the 1960s, and their effectiveness in diverse settings is well documented. However, until ACA was passed in 2010, CHW roles within health care systems were limited.

This brief, developed with support from the Commonwealth Fund, highlights the ways that states are using SIM grants to integrate Community Health Workers into value-based health care systems. States can use their SIM experience and momentum from aligning multiple stakeholders to overcome the challenges to diffusing CHWs throughout the health care system.

READ THE BRIEF


Hospital Uncompensated Care in the United States, 2015 – Comparison of Midwest States

Hospital doctor sits at a desk with a laptop, clipboard, and phone.Since the launch of health insurance coverage expansion in 2014 under the Affordable Care Act (ACA), Michigan and other states have experienced large decreases in the number of adults who lack health insurance, delay necessary care, and have trouble paying their medical bills.(1) Austic, E. Lawton, M. Slowey, M. Riba, and M. Udow-Phillips, Changes in Health Care Cost Barriers under the Affordable Care Act in Michigan (Ann Arbor, MI: Center for Healthcare Research and Transformation, March 2017). However, these effects have not been even nationwide, as 21 states had not adopted the ACA’s optional Medicaid expansion by the end of 2015.(2) Dussault, M. Pinkovskiy, and B. Zafar, “Is Health Insurance Good for Your Financial Health?” Liberty Street Economics, June 6, 2016: http://libertystreeteconomics.newyorkfed.org/2016/06/is-health-insurance-good-for-your-financial-health.html (accessed 3/10/17). Hospitals are particularly affected by health insurance coverage expansions because many hospitals have traditionally provided free and/or reduced price services to low-income and uninsured patients as part of their social mission and community benefit requirements. Prior to the ACA coverage expansion, health care providers, including hospitals, provided approximately $1,000 of uncompensated care per uninsured individual.(3)T. A. Coughlin et al.,  “An Estimated $84.9 Billion in Uncompensated Care Was Provided in 2013; ACA Payment Cuts Could Challenge Providers,” Health Affairs, May 2014, 33(5): 807–14: http://content.healthaffairs.org/content/33/5/807.full (accessed 3/10/17).(accessed 3/10/17). This report examines the effect of health care expansion on hospital uncompensated care with a comparison of Midwest states.

Hospitals have two forms of uncompensated care: charity care and bad debt.(4) Broader definitions of uncompensated care may include underpayments from Medicare and Medicaid, but underpayments were not included in this analysis.  Charity care is delivered to indigent patients without the expectation of receiving payment, and bad debt occurs when a hospital bills for but is unable to collect the entire amount due from a patient.(5) Hospitals have different procedures and qualifications for how patients can apply for charity care assistance, which limits the comparison of charity care and bad debt measures across hospitals.This report updates an earlier CHRT report(6) Fangmeier and M. Udow-Phillips, “Hospital Uncompensated Care, 2014,” Cover Michigan 2016 (Ann Arbor, MI: Center for Healthcare Research and Transformation, 2016). to measure the effect of the ACA’s coverage expansion, particularly the optional Medicaid expansion, on hospital uncompensated care costs and other financial outcomes. In addition, this report compares trends in uncompensated care across eight selected Midwestern states.

Key Findings

  • Uncompensated care costs for hospitals decreased by about 23 percent nationwide from 2013 to 2015, but hospitals in Medicaid expansion states experienced much sharper deceases (39 percent) than those in non-expansion states (4 percent).
  • Almost all selected states in the Midwest experienced decreases in uncompensated care from 2011 to 2015, while Missouri, a non-expansion state, experienced an increase in uncompensated care during this time.
  • Compared to other selected Midwestern states, Michigan experienced the largest relative decline in uncompensated care costs from 2011 to 2015.

Health Insurance Coverage Expansions and Uncompensated Care

Several studies have examined the relationship between health insurance coverage expansions and the provision of uncompensated care by hospitals. As part of the Oregon Health Insurance Experiment—a randomized study of the effects of Medicaid coverage on adults—researchers found that a large share of the value of Medicaid spending for new enrollees went to external parties, including health care providers, who were previously providing care without payment.(7)A. Finkelstein, N. Hendren, and E.  Luttmer, “The Value of Medicaid: Interpreting Results from the Oregon Health Insurance Experiment,” NBER Working  Paper 21308 (Cambridge, MA: National Bureau of Economic Research, June 2015): http://www.nber.org/papers/w21308 (accessed 3/10/17).

Other researchers have found that every uninsured patient costs hospitals $900 and that hospital closures increase uncompensated care at nearby hospitals. They also found that increases in uninsured populations cut into profit margins, suggesting that hospitals cannot fully pass along the costs of uncompensated care to insurance companies.(8)C. Garthwaite, T. Gross, and M. Notowidigdo, “Hospitals as Insurers of Last Resort,” NBER Working Paper 21290 (Cambridge, MA: National Bureau of Economic Research, June 2015): http://www.nber.org/papers/w21290 (accessed 3/10/17).

Recent studies have documented the decline in hospital uncompensated care after the ACA’s coverage expansion began in 2014. One study found that state Medicaid expansion was associated with a $2.8 million decrease in uncompensated care per hospital and improved profit margins.(9)F. Blavin, “Association Between the 2014 Medicaid Expansion and US Hospital Finances,” Journal of the American Medical Association, Oct. 11, 2016, 316(14): 1475–83.2016: http://jamanetwork.com/journals/jama/fullarticle/2565750 (accessed 3/10/17). Another study found larger uncompensated care reductions for hospitals in Medicaid expansion states that had greater pre-ACA uncompensated care burdens or were located in regions with greater numbers of people who became newly eligible for Medicaid.(10)D. Dranove, C. Garthwaite, and C. Ody, “Uncompensated Care Decreased at Hospitals in Medicaid Expansion States But Not at Hospitals in Nonexpansion States,” Health Affairs, Aug. 2016, 35(8): 1471–9: http://content.healthaffairs.org/content/35/8/1471.abstract (accessed 3/10/17).

Many of these trends continued into 2015. The American Hospital Association (AHA) found that uncompensated care costs for hospitals nationwide decreased from $42.8 billion in 2014 to $35.7 billion in 2015. The ratio of uncompensated care to total expenses also fell substantially and is now the lowest it has been since the AHA began reporting in 1990.(11)American Hospital Association, Uncompensated Hospital Care Cost Fact Sheet, December 2016:  http://www.aha.org/content/16/uncompensatedcarefactsheet.pdf (accessed 3/10/2017).

With the reduction in uninsured patients, some hospital systems expanded their qualification rules for charity care to provide assistance to patients with high deductibles and other out-of-pocket costs. In 2016, Ascension Health began waiving unpaid bills for patients with an income below 250 percent of the federal poverty level (FPL) and experienced a 12 percent increase in charity care costs in 2016.(12)Ascension. Management’s Discussion and Analysis of Financial Condition and Results of Operations for Ascension, n.d.:  http://ascension.org/~/media/files/ascension/about/community-investor-relations/2017/management-discussion-q2-2017.pdf?la=en (accessed 3/10/2017).

Hospital Uncompensated Care and Financial Trends

In the present study, CHRT used Medicare cost reports to examine the financial characteristics of 3,474 hospitals across the United States. Based on this data, we found that hospitals provided $28.8 billion in uncompensated care in 2013, prior to the ACA’s coverage expansion (see Figure 1). Beginning in 2013, Medicaid expansion states experienced sharp decreases in uncompensated care, declining by 39 percent by 2015. By comparison, non-expansion states showed a 4 percent decrease, and some states experienced increases in uncompensated care (see Appendix).

Figure 1: Hospital Uncompensated Care Costs for Medicaid Expansion and Non-Expansion States, 2011–2015
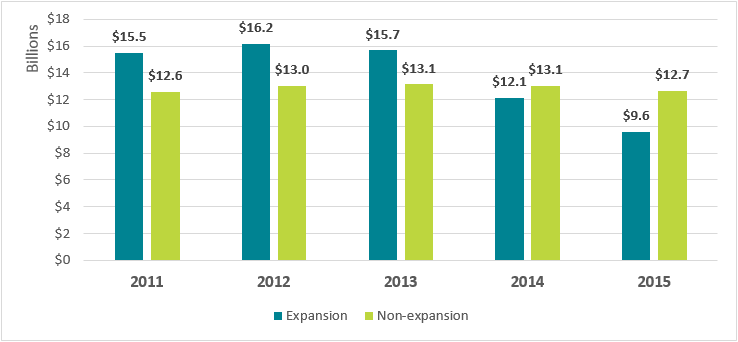
Figure 1: Hospital Uncompensated Care Costs for Medicaid Expansion and Non-Expansion States, 2011–2015

Regional Comparison of Uncompensated Care Trends

To better understand the connection between coverage expansion and hospital uncompensated care, CHRT compared eight Midwestern states with varying market and policy characteristics. For example, hospitals in Michigan, Ohio, and Illinois were more likely to have a teaching program for the graduate medical education of residents (see Figure 2). Hospitals in Iowa, Minnesota, and Wisconsin were more likely to have a critical access designation as a rural provider and have fewer hospital beds. Missouri and Indiana hospitals were more likely to be part of investor-owned, for-profit companies compared to the other Midwestern states.

Figure 2: Characteristics of Hospitals in Selected Midwestern States

Figure 2: Characteristics of Hospitals in Selected Midwestern States

States across the Midwest have taken different approaches to setting Medicaid eligibility for low-income adults. Minnesota took advantage of the ACA’s option for states to expand coverage prior to 2014 and allowed adults with an income less than 75 percent of the FPL to enroll in 2011.(13)Sommers, G. Kenney and A. Epstein, “New Evidence On The Affordable Care Act: Coverage Impacts Of Early Medicaid Expansions”, Health Affairs, Jan. 2014, 33(1):78–87: http://content.healthaffairs.org/content/33/1/78.full (accessed 3/10/17).

Illinois, Iowa, Minnesota, and Ohio then adopted the full Medicaid expansion on January 1, 2014. Indiana and Michigan expanded enrollment on April 1, 2014, and February 1, 2015, respectively (see Figure 3). Illinois, Michigan, and Ohio all experienced a decrease in their uninsured population of over 40 percent from 2013 to 2015.

Neither Missouri nor Wisconsin has expanded Medicaid. However, Wisconsin is the only non-expansion state in the country that does not have a coverage gap for financial assistance.(14)Adults with incomes below 100 percent FPL in all other non-expansion states fall into a coverage gap because they are ineligible for Medicaid coverage, and tax credits to purchase coverage on the health insurance marketplace are only available to those with incomes above 100 percent FPL.Wisconsin’s Medicaid program covers adults with income up to 100 percent FPL, and adults whose income is above the poverty line are eligible for financial assistance through the health insurance marketplace. In contrast, childless non-disabled adults in Missouri are not eligible for Medicaid, regardless of income level.

Figure 3: Characteristics of Medicaid and Health Insurance Coverage in Selected Midwestern States
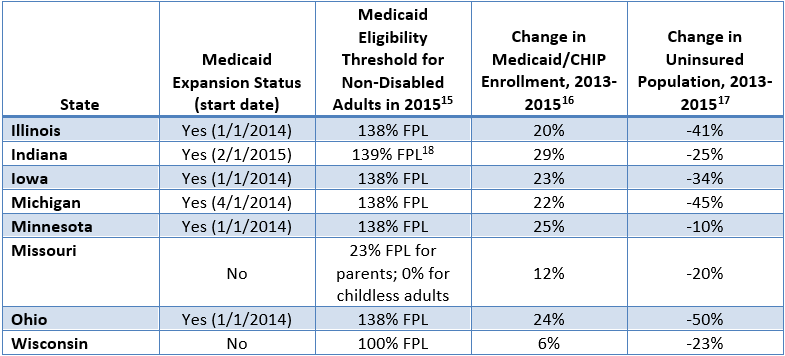
Figure 3: Characteristics of Medicaid and Health Insurance Coverage in Selected Midwestern States

(15)Kaiser Family Foundation, Medicaid Income Eligibility Limits for Other Non-Disabled Adults, 2011–2017, http://kff.org/data-collection/trends-in-medicaid-income-eligibility-limits/ (accessed 3/10/17) (16)Gates, R. Rudowitz, and S. Artiga, Two Year Trends in Medicaid and CHIP Enrollment Data: Findings from the CMS Performance Indicator Project (Menlo Park, CA: Henry J. Kaiser Family Foundation, June 2016): http://files.kff.org/attachment/Issue-Brief-Two-Year-Trends-in-Medicaid-and-CHIP-Enrollment-Data (accessed 3/10/17). (17)Kaiser Family Foundation. State Health Facts: Health Insurance Coverage of the Total Population, 2015: http://kff.org/other/state-indicator/total-population/ (accessed 3/10/17). (18)Indiana uses a state-specific income disregard that results in a slightly greater eligibility threshold for the group.


From 2011 to 2015, nearly all of the selected Midwestern states experienced a decrease in hospital uncompensated care costs (see Figure 4). Minnesota, with its early Medicaid expansion, saw uncompensated care decline immediately after 2011. States that expanded in 2014 experienced sharp declines from 2013 to 2014. Indiana, which expanded in early 2015, saw a drop in uncompensated care in 2015 after experiencing rising levels for three straight years from 2011 to 2014. Uncompensated care in Missouri, which did not expand Medicaid, is still above 2011 levels.

Overall, Michigan experienced the largest relative decrease in uncompensated care among the selected Midwestern states, dropping to 49 percent of 2011 levels in 2015. Wisconsin, which did not expand Medicaid but does not have a coverage gap, saw uncompensated care drop to 64 percent of 2011 levels. A study by the Wisconsin Hospital Association found similar declines in uncompensated care, especially from 2013 to 2015.(19)Wisconsin Hospital Association, Uncompensated Health Care Report,. Fiscal Year 2015 (Madison, WI: WHA Information Center, Sept. 2016): http://www.whainfocenter.com/uploads/PDFs/Publications/Uncompensated/Uncompensated_2015.pdf (accessed 3/10/17)

Figure 4: Uncompensated Care Costs Compared to 2011 Levels, by State
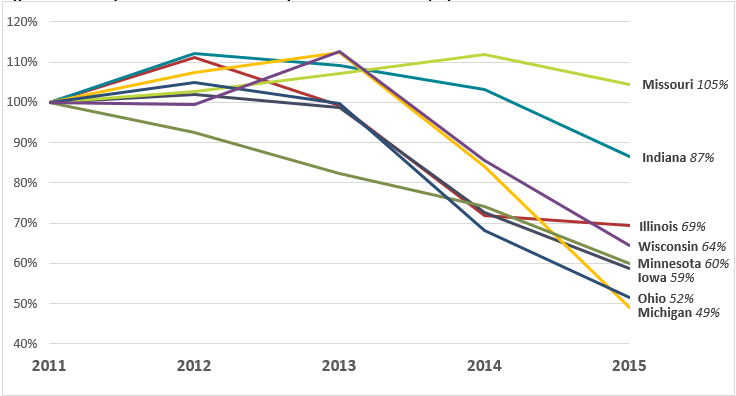
Figure 4: Uncompensated Care Costs Compared to 2011 Levels, by State


Conclusion

Medicaid expansion states have continued to experience large declines in hospital uncompensated care costs since 2014. As debate among state and federal policymakers about the future of the Affordable Care Act continues, it will be important to examine the connection between health insurance coverage expansions and financial outcomes for health care providers. Not all hospitals experienced the same effects of coverage expansion on uncompensated care, and it is not clear how hospitals would respond to policy changes that reduce the coverage gains under the ACA or the value of coverage to those who became newly insured.

Data and Methodology

We extracted hospital data on uncompensated care and other facility characteristics from publicly available cost reports submitted by hospitals to the Centers for Medicare and Medicaid Services (CMS) via the Healthcare Cost Report Information System (HCRIS). Data include reports collected by December 31, 2016, which were released on January 19, 2017. For this analysis, we restricted the set of hospitals to short-term acute and critical access hospitals that submitted complete reports for each year from 2011 through 2014. This eliminated rehabilitation, long-term, psychiatric, children’s, and other specialty hospitals that have high nonresponse rates or are not largely affected the ACA’s Medicaid expansion. The resulting data set includes 3,474 hospitals nationwide.

Hospitals submit worksheet S-10 as part of their cost report that breaks down their uncompensated care costs into their separate sources. In our analysis, we define uncompensated care as the sum of charity care (care delivered with no expectation of payment) and bad debt (care that is billed but no payment is received), but underpayments from public payers (Medicare, Medicaid, and the Children’s Health Insurance Program) were excluded. The use of cost report data for uncompensated care research is still relatively new, and not all responses from hospitals are audited by CMS. However, MedPAC has supported using worksheet S-10 to directly measure uncompensated care costs.(20)

Medicare Payment Advisory Commission. Report to the Congress: Medicare Payment Policy. March 2016.  http://www.medpac.gov/docs/default-source/reports/march-2016-report-to-the-congress-medicare-payment-policy.pdf services.pdf?sfvrsn=0 (accessed 6/6/17).
 Data for inpatient days and outpatient visits were extracted from worksheet S-3, part 1, and data on operating margins were extracted from worksheet G-3 of the cost reports.

Cost reports submitted to hospitals are based on individual hospitals’ fiscal years, which have varying beginning and end dates. To generate comparable time-series measures, we converted hospital fiscal year measures to calendar year estimates by combining the portion of each fiscal year that fell within a given calendar year. Uncompensated care amounts were converted from charges to costs using hospital-specific cost-to-charge ratios calculated in the cost reports, and all financial measures were adjusted for inflation to 2014 dollars. Facilities that reported outlier uncompensated care amounts compared to their historic trend were dropped from the study.

Hospitals were identified as for-profit, nonprofit, or government-owned based on control status data from the 2013 American Hospital Association annual survey.(21)American Hospital Association, Annual Survey Database: http://www.aha.org/research/rc/stat-studies/data-and-directories.shtml (accessed 3/17/16). Metropolitan status was determined based on the U.S. Department of Agriculture’s rural-urban continuum codes for 2013,(22)U.S. Department of Agriculture,Economic Research Service, Rural-Urban Continuum Codes: http://www.ers.usda.gov/data-products/rural-urban-continuum-codes.aspx (accessed 3/17/16). and hospitals were identified as teaching institutions if they indicated in their cost reports that they train residents as part of an approved graduate medical education program.

Appendix

Figure A-1: Uncompensated Care Trends in the United States, 2011–2015

Figure A-1: Uncompensated Care Trends in the United States, 2011–2015

Figure A-2: Uncompensated Care Trends by State, Medicaid Expansion States, 2011–2015
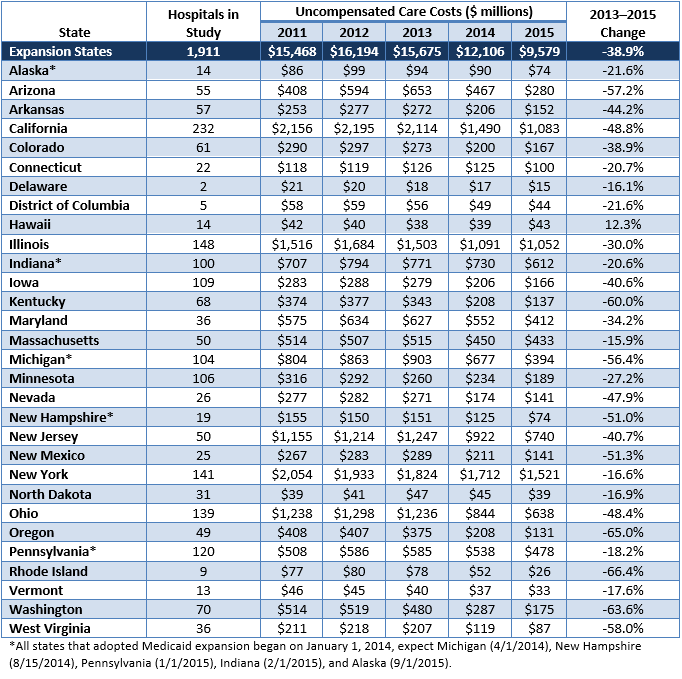
Figure A-2: Uncompensated Care Trends by State, Medicaid Expansion States, 2011–2015

Figure A-3: Uncompensated Care Trends by State, Non-Expansion States, 2011–2015
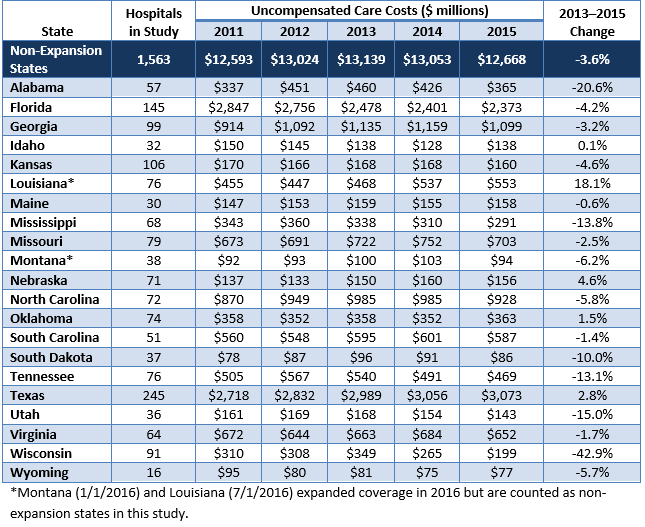
Figure A-3: Uncompensated Care Trends by State, Non-Expansion States, 2011–2015


References

References
1 Austic, E. Lawton, M. Slowey, M. Riba, and M. Udow-Phillips, Changes in Health Care Cost Barriers under the Affordable Care Act in Michigan (Ann Arbor, MI: Center for Healthcare Research and Transformation, March 2017).
2  Dussault, M. Pinkovskiy, and B. Zafar, “Is Health Insurance Good for Your Financial Health?” Liberty Street Economics, June 6, 2016: http://libertystreeteconomics.newyorkfed.org/2016/06/is-health-insurance-good-for-your-financial-health.html (accessed 3/10/17).
3 T. A. Coughlin et al.,  “An Estimated $84.9 Billion in Uncompensated Care Was Provided in 2013; ACA Payment Cuts Could Challenge Providers,” Health Affairs, May 2014, 33(5): 807–14: http://content.healthaffairs.org/content/33/5/807.full (accessed 3/10/17).(accessed 3/10/17).
4 Broader definitions of uncompensated care may include underpayments from Medicare and Medicaid, but underpayments were not included in this analysis.
5 Hospitals have different procedures and qualifications for how patients can apply for charity care assistance, which limits the comparison of charity care and bad debt measures across hospitals.
6 Fangmeier and M. Udow-Phillips, “Hospital Uncompensated Care, 2014,” Cover Michigan 2016 (Ann Arbor, MI: Center for Healthcare Research and Transformation, 2016).
7 A. Finkelstein, N. Hendren, and E.  Luttmer, “The Value of Medicaid: Interpreting Results from the Oregon Health Insurance Experiment,” NBER Working  Paper 21308 (Cambridge, MA: National Bureau of Economic Research, June 2015): http://www.nber.org/papers/w21308 (accessed 3/10/17).
8 C. Garthwaite, T. Gross, and M. Notowidigdo, “Hospitals as Insurers of Last Resort,” NBER Working Paper 21290 (Cambridge, MA: National Bureau of Economic Research, June 2015): http://www.nber.org/papers/w21290 (accessed 3/10/17).
9 F. Blavin, “Association Between the 2014 Medicaid Expansion and US Hospital Finances,” Journal of the American Medical Association, Oct. 11, 2016, 316(14): 1475–83.2016: http://jamanetwork.com/journals/jama/fullarticle/2565750 (accessed 3/10/17).
10 D. Dranove, C. Garthwaite, and C. Ody, “Uncompensated Care Decreased at Hospitals in Medicaid Expansion States But Not at Hospitals in Nonexpansion States,” Health Affairs, Aug. 2016, 35(8): 1471–9: http://content.healthaffairs.org/content/35/8/1471.abstract (accessed 3/10/17).
11 American Hospital Association, Uncompensated Hospital Care Cost Fact Sheet, December 2016:  http://www.aha.org/content/16/uncompensatedcarefactsheet.pdf (accessed 3/10/2017).
12 Ascension. Management’s Discussion and Analysis of Financial Condition and Results of Operations for Ascension, n.d.:  http://ascension.org/~/media/files/ascension/about/community-investor-relations/2017/management-discussion-q2-2017.pdf?la=en (accessed 3/10/2017).
13 Sommers, G. Kenney and A. Epstein, “New Evidence On The Affordable Care Act: Coverage Impacts Of Early Medicaid Expansions”, Health Affairs, Jan. 2014, 33(1):78–87: http://content.healthaffairs.org/content/33/1/78.full (accessed 3/10/17).

14 Adults with incomes below 100 percent FPL in all other non-expansion states fall into a coverage gap because they are ineligible for Medicaid coverage, and tax credits to purchase coverage on the health insurance marketplace are only available to those with incomes above 100 percent FPL.
15 Kaiser Family Foundation, Medicaid Income Eligibility Limits for Other Non-Disabled Adults, 2011–2017, http://kff.org/data-collection/trends-in-medicaid-income-eligibility-limits/ (accessed 3/10/17)
16 Gates, R. Rudowitz, and S. Artiga, Two Year Trends in Medicaid and CHIP Enrollment Data: Findings from the CMS Performance Indicator Project (Menlo Park, CA: Henry J. Kaiser Family Foundation, June 2016): http://files.kff.org/attachment/Issue-Brief-Two-Year-Trends-in-Medicaid-and-CHIP-Enrollment-Data (accessed 3/10/17).
17 Kaiser Family Foundation. State Health Facts: Health Insurance Coverage of the Total Population, 2015: http://kff.org/other/state-indicator/total-population/ (accessed 3/10/17).
18 Indiana uses a state-specific income disregard that results in a slightly greater eligibility threshold for the group.
19 Wisconsin Hospital Association, Uncompensated Health Care Report,. Fiscal Year 2015 (Madison, WI: WHA Information Center, Sept. 2016): http://www.whainfocenter.com/uploads/PDFs/Publications/Uncompensated/Uncompensated_2015.pdf (accessed 3/10/17)
20

Medicare Payment Advisory Commission. Report to the Congress: Medicare Payment Policy. March 2016.  http://www.medpac.gov/docs/default-source/reports/march-2016-report-to-the-congress-medicare-payment-policy.pdf services.pdf?sfvrsn=0 (accessed 6/6/17).

21 American Hospital Association, Annual Survey Database: http://www.aha.org/research/rc/stat-studies/data-and-directories.shtml (accessed 3/17/16).
22 U.S. Department of Agriculture,Economic Research Service, Rural-Urban Continuum Codes: http://www.ers.usda.gov/data-products/rural-urban-continuum-codes.aspx (accessed 3/17/16).

Changes in Health Care Cost Barriers under the Affordable Care Act in Michigan

A balance with medication on one side and money on the other.The Affordable Care Act (ACA) not only significantly expanded access coverage starting in 2014, but also sought to improve access to services by reducing cost barriers to care and requiring coverage of certain “essential benefits”. For example, the ACA established patient annual out-of-pocket cost maximums; eliminated patient cost sharing for certain preventive care services; and prohibited annual and lifetime limits on benefits. The ACA expanded access to coverage primarily in the individual market through the Health Insurance Marketplace and by expanding Medicaid based on household income.

The Medicaid expansion allowed states to offer federal subsidies covering 90 to 100 percent of costs for Medicaid coverage to adults whose household income was below 138% of the federal poverty level (FPL).(1)Status of State Action on the Medicaid Expansion Decision (Henry J. Kaiser Family Foundation. March, 2016): http://kff.org/health-reform/state-indicator/state-activity-around-expanding-medicaid-under-the-affordable-care-act/?currentTimeframe=0 (accessed 01/28/2017) By the end of the second year of ACA implementation in Michigan (2015), nearly 2.37 million of Michigan’s 9.92 million residents (about 24 percent of Michiganders) were enrolled in Medicaid(2)Green Book Report of Key Program Statistics (State of Michigan Department of Human Services, Dec. 2015). http://www.michigan.gov/mdhhs/0,5885,7-339-73970_61179_10830—Y_2015,00.html (accessed 01/28/2017) — up from 1.93 million in April of 2014 (around 20 percent of Michiganders), when the Medicaid expansion program was first launched in Michigan.(3)Green Book Report of Key Program Statistics (State of Michigan Department of Human Services, Dec. 2014). http://www.michigan.gov/mdhhs/0,5885,7-339-73970_61179_10830—Y_2014,00.html (accessed 01/28/2017) This represents a net increase of around 440,000 Michigan Medicaid enrollees between 2012 and 2015.(4)Green Book Report of Key Program Statistics (State of Michigan Department of Human Services, Dec. 2012). http://www.michigan.gov/mdhhs/0,5885,7-339-73970_61179_10830—Y_2012,00.html (accessed 01/28/2017)

Federal marketplace subsidies were also made available to consumers with incomes between 100% and 400% of the FPL who were not eligible for Medicaid or  affordable employer-based coverage (i.e., coverage costing more than about 9.5% of the employee’s  household income). Around 272,000(5)Health Insurance Marketplace Summary Enrollment Report for the Initial Annual Open Enrollment Period (State of Michigan Department of Health and Human Services, Office of the Assistant Secretary for Planning and Evaluation, May 1, 2014). https://aspe.hhs.gov/pdf-report/health-insurance-marketplace-summary-enrollment-report-initial-annual-open-enrollment-period (accessed 01/28/2017) Michigan adults signed up for federal marketplace plans during the first 2014 open-enrollment period, while 341,000(6)Health Insurance Marketplace Summary Enrollment Report for the Initial Annual Open
Enrollment Period (State of Michigan Department of Health and Human Services, Office of the Assistant Secretary for Planning and Evaluation, March 10, 2015). https://aspe.hhs.gov/pdf-report/health-insurance-marketplace-2015-open-enrollment-period-march-enrollment-report (accessed 01/28/2017)
signed up during the first 2015  open-enrollment period.

Our findings show that since insurance has been expanded in Michigan under the ACA, cost-related  barriers to care and delaying care have been reduced significantly. Thus, the ACA seems to have  succeeded in reducing some barriers to accessing and affording health care. Now that changes in the  Affordable Care Act are all but certain, it will be important to assess proposed approaches to coverage and care with the experience of the Affordable Care Act in mind so that the progress we see evidenced with these data is not erased. This brief presents findings on how health care access changed in Michigan with ACA implementation, using the Center for Healthcare Research & Transformation’s 2010, 2012, 2014, and 2015 Cover Michigan Surveys.

Key Findings

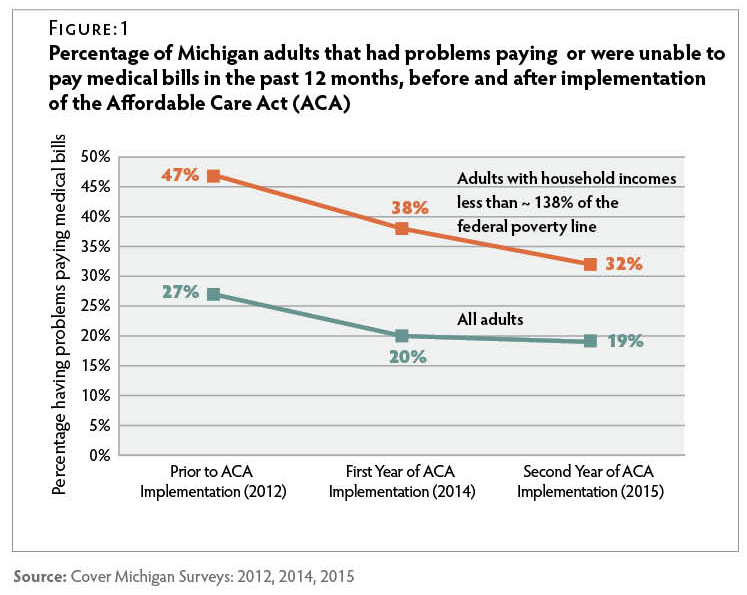
  • During the first two years of ACA implementation, there was a significant and sustained drop in the proportion of Michigan adults who reported having trouble paying their medical bills.
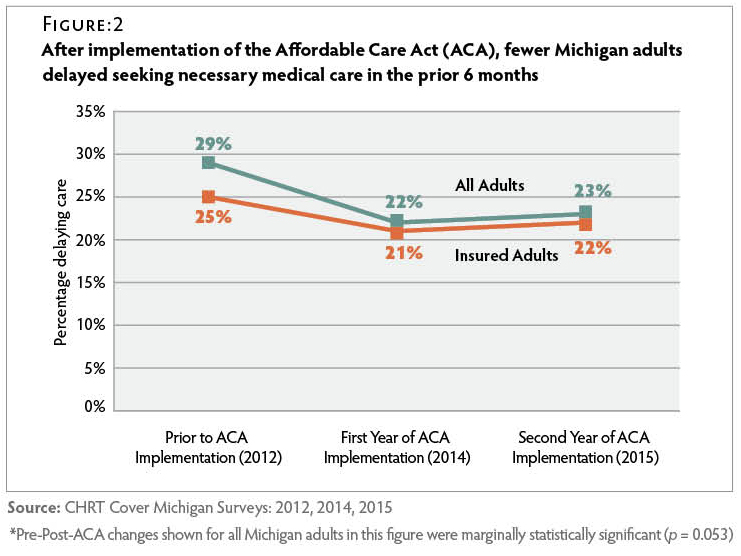
  • Fewer Michigan adults delayed seeking necessary medical care after ACA implementation.
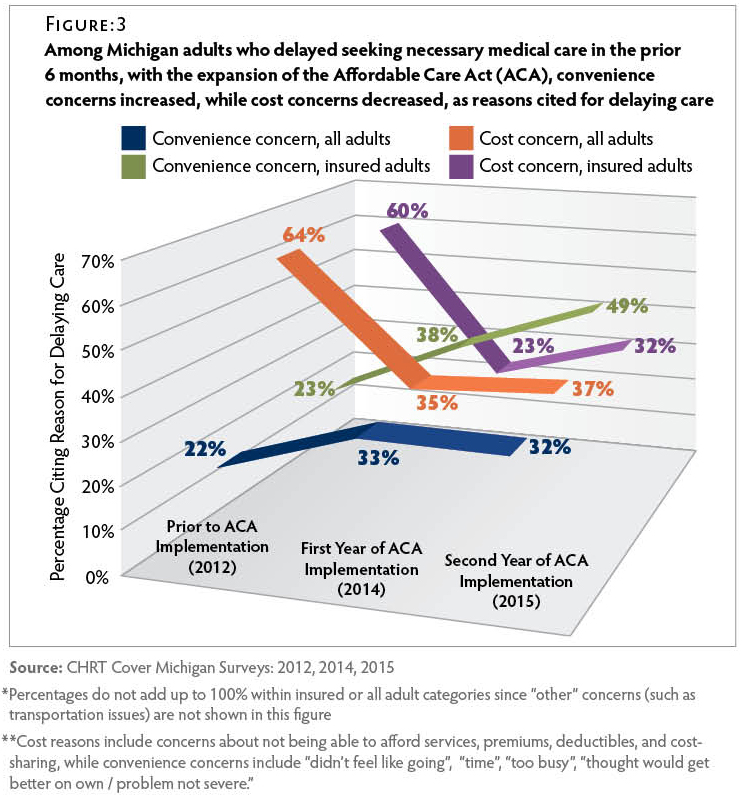
  • Prior to ACA implementation, among Michigan adults who delayed seeking necessary medical care in the previous six months, more than half cited cost concerns as reasons for delaying care. By the second year of ACA implementation, cost concerns had become less prominent, and convenience concerns (such as being too busy or not having time to go) were cited just as often as cost concerns among all Michigan adults, and more often than cost concerns among those with coverage.

Changes in Medical Financial Burden

The proportion of Michiganders who reported having problems paying medical bills decreased significantly after the introduction of the ACA. In the second year of open enrollment, 19 percent of respondents reported problems paying medical bills during the previous twelve months, compared to 20 percent during the first year of open enrollment, and 27 percent two years prior to the implementation of the ACA. Figure 1 This represents an 8-percentage-point drop in the proportion of all Michigan adults having problems paying medical bills.

Both before and after the ACA implementation, around one in six respondents had a household income below — or within a few thousand dollars of being below — 138% of the Federal Poverty Line (FPL) (adjusted by year and household size). The proportion of low-income Michigan adults did not significantly decrease over time, but there was a statistically significant 15-percentage-point drop in the proportion of low-income Michigan adults who reported having problems paying or being unable to pay medical bills. This reduction in medical financial burden is likely the result of more people gaining coverage, as well as increased financial protections for insured patients under the ACA, such as elimination of insurer lifetime and annual limits on benefits, and establishment of patient annual out-of-pocket cost maximums.

Delaying Care

By the second year of implementation of the ACA (2015), 5 percent of respondents were uninsured, compared to 14 percent before the ACA implementation (2012). In 2015, 23 percent of Michigan adults reported that they had delayed seeking necessary medical care in the prior 6 months, which was a reduction from 29 percent in 2012 (p = 0.053). Figure 2

Before the roll-out of the ACA in Michigan, cost concerns were cited by more than half of those delaying necessary care — even among the insured. Figure 3 Cost concerns included the perceived expense of seeking care or concern about the amount of copays and/or deductibles. When respondents were asked why they had delayed care during the first two years of ACA implementation, reasons related to cost decreased dramatically, with only about one in three citing them. By the second year of ACA implementation, when respondents were asked why they had delayed care, approximately twice as many insured Michigan adults reported doing so due to convenience concerns as did before the ACA was introduced. Convenience concerns included not feeling like going, being too busy to go, and thinking one could get better on one’s own because the problem was not severe.

Although fewer respondents reported delaying seeking necessary care due to cost concerns in more recent years, cost issues — such as having trouble paying medical bills — remained a challenge for about one in five Michigan adults, as shown in Figure 1.

Conclusion

Since the implementation of the ACA, far fewer Michigan adults are having trouble paying medical bills, and fewer are delaying seeking necessary medical care due to cost concerns. As the federal government looks to make what may be significant changes to this law, emphasis should be placed on continuing to reduce cost-related barriers to health care.

Methodology

The survey data presented in this brief were produced from a series of survey questions added to the Michigan State University Institute for Public Policy and Social Research (IPPSR) quarterly State of the State Survey. A full report of the IPPSR State of the State Survey methodology can be found at: http://ippsr.msu.edu/soss/.

Demographic and socio-economic characteristics of the Cover Michigan Survey samples can be found at: https://chrt.org/demographic-socio-economic-characteristics-cover-michigan-survey-samples/ . A description of methods used for CHRT’s Cover Michigan briefs can be found at: https://chrt.org/cover-michigan-survey-methods/


Acknowledgments: The staff at the Center for Healthcare Research & Transformation would like to thank Robert Goodman, Helen Levy, Sanjay Saint, Renuka Tipirneni, and the staff at the Institute for Public Policy and Social Research (IPPSR) at Michigan State University for their assistance with the design and analysis of the survey.

References

References
1 Status of State Action on the Medicaid Expansion Decision (Henry J. Kaiser Family Foundation. March, 2016): http://kff.org/health-reform/state-indicator/state-activity-around-expanding-medicaid-under-the-affordable-care-act/?currentTimeframe=0 (accessed 01/28/2017)
2 Green Book Report of Key Program Statistics (State of Michigan Department of Human Services, Dec. 2015). http://www.michigan.gov/mdhhs/0,5885,7-339-73970_61179_10830—Y_2015,00.html (accessed 01/28/2017)
3 Green Book Report of Key Program Statistics (State of Michigan Department of Human Services, Dec. 2014). http://www.michigan.gov/mdhhs/0,5885,7-339-73970_61179_10830—Y_2014,00.html (accessed 01/28/2017)
4 Green Book Report of Key Program Statistics (State of Michigan Department of Human Services, Dec. 2012). http://www.michigan.gov/mdhhs/0,5885,7-339-73970_61179_10830—Y_2012,00.html (accessed 01/28/2017)
5 Health Insurance Marketplace Summary Enrollment Report for the Initial Annual Open Enrollment Period (State of Michigan Department of Health and Human Services, Office of the Assistant Secretary for Planning and Evaluation, May 1, 2014). https://aspe.hhs.gov/pdf-report/health-insurance-marketplace-summary-enrollment-report-initial-annual-open-enrollment-period (accessed 01/28/2017)
6 Health Insurance Marketplace Summary Enrollment Report for the Initial Annual Open
Enrollment Period (State of Michigan Department of Health and Human Services, Office of the Assistant Secretary for Planning and Evaluation, March 10, 2015). https://aspe.hhs.gov/pdf-report/health-insurance-marketplace-2015-open-enrollment-period-march-enrollment-report (accessed 01/28/2017)

Rate Analysis: Michigan’s 2017 Health Insurance Marketplace

health

Screenshot of HealthCare.gov, with information on the 2017 Health Insurance Marketplace.While the results of the 2016 presidential election have sparked recent debates about options to repeal and replace the Affordable Care Act, the health insurance marketplaces created under the law continue to operate as usual. So although the future of the law remains unknown, Michigan consumers who enroll in the 2017 Health Insurance Marketplace can likely expect their coverage to remain uninterrupted for the 2017 plan year.

The changing dynamics of the health insurance marketplace are important for 2017 enrollees to understand. Under current federal policy, enrollees who do not actively apply and enroll in 2017 coverage are auto-renewed into their 2016 plan, if it continues to be offered. Beginning with the 2017 open enrollment period, individuals who were enrolled in a plan offered by an issuer that is no longer participating in the marketplace will automatically be enrolled into a plan offered in their area by a different carrier if they do not actively choose another plan.

In addition, changes to benchmark plans directly affect premium tax credit amounts, so many enrollees will need to balance potentially higher costs for renewing their 2016 plan with other important considerations, such as the breadth of available provider networks.

READ THE BRIEF

Insurance Churning

White and blue churning waterThe uninsured rate has declined substantially since provisions of the Patient Protection and Affordable Care Act (ACA) came into effect. Nevertheless, many individuals continue to experience instability in insurance coverage. Transitions between different insurance plans, as well as between insured and uninsured status, are often referred to as “insurance churning.”

The causes of insurance churning vary. Changes in job status may result in loss of coverage or transition to a new insurance plan. Eligibility for Medicaid or plans with Marketplace subsidies may change based on changes in family composition or fluctuations in income. Nationally, three to five percent of members are dropped each month by health plans offered on the Health Insurance Exchange due to non-payment of premiums.

Insurance churning can affect quality, cost, and continuity of care. Individuals may avoid seeking health care when they need it during gaps in insurance coverage. Even if consumers maintain continuous coverage while transitioning between different insurance plans, they may find that their regular health care providers do not accept their new insurance plan. In addition, when they change health plans, research shows that medication compliance is often disrupted. These and other churning-related problems tend to be exacerbated by uncertainty about what new co-pays or deductibles might be as well as by known increased costs associated with new insurance plans.

A recent study found no evidence of significant increases or decreases in broader indicators of insurance churning since the introduction of the ACA in three states (Texas, Kentucky, and Arkansas). Under the new administration, depending on which provisions of the ACA are repealed, replaced, defunded, or retained in the coming years and how these changes are implemented, rates of insurance churning could change dramatically.

Between 2013 and 2015, data from the Census Bureau show that the proportion of Michiganders who reported no source of health insurance declined by five percentage points—from 11 percent to 6 percent. Using data from the Center for Health and Research Transformation’s Cover Michigan Survey, this brief explores consumer experiences with insurance churning and access to care within the state of Michigan for approximately a one-year period in 2014–2015.

Key findings include:

  • Medicaid recipients had the most instability in their coverage status of all respondents to the survey. Medicaid recipients were also seven times more likely to have experienced a temporary uninsured period in the past year compared to respondents with employer-sponsored or individual coverage.
  • Those with individually purchased coverage in 2014 were the most likely to switch to a different type of coverage in 2015. Among respondents with an individually purchased plan in 2014, less than half reenrolled in the same plan in 2015, and nearly a third transitioned to Medicare or to an employer-sponsored plan in 2015.
  • Those with employer-sponsored coverage experienced the least amount of churning compared to respondents with other coverage. Ninety-four percent of respondents with employer-sponsored coverage remained continuously insured from 2014 to 2015.

READ THE REPORT