 Since the launch of health insurance coverage expansion in 2014 under the Affordable Care Act (ACA), Michigan and other states have experienced large decreases in the number of adults who lack health insurance, delay necessary care, and have trouble paying their medical bills. However, these effects have not been even nationwide, as 21 states had not adopted the ACA’s optional Medicaid expansion by the end of 2015. Hospitals are particularly affected by health insurance coverage expansions because many hospitals have traditionally provided free and/or reduced price services to low-income and uninsured patients as part of their social mission and community benefit requirements. Prior to the ACA coverage expansion, health care providers, including hospitals, provided approximately $1,000 of uncompensated care per uninsured individual. This report examines the effect of health care expansion on hospital uncompensated care with a comparison of Midwest states.
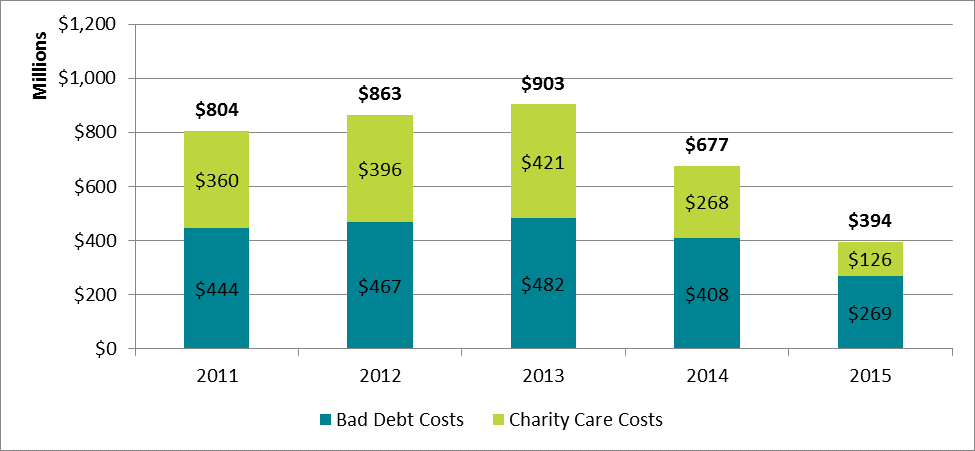
Hospitals have two forms of uncompensated care: charity care and bad debt. Charity care is delivered to indigent patients without the expectation of receiving payment, and bad debt occurs when a hospital bills for but is unable to collect the entire amount due from a patient.This report updates an earlier CHRT report to measure the effect of the ACA’s coverage expansion, particularly the optional Medicaid expansion, on hospital uncompensated care costs and other financial outcomes. In addition, this report compares trends in uncompensated care across eight selected Midwestern states.
Key Findings
- Uncompensated care costs for hospitals decreased by about 23 percent nationwide from 2013 to 2015, but hospitals in Medicaid expansion states experienced much sharper deceases (39 percent) than those in non-expansion states (4 percent).
- Almost all selected states in the Midwest experienced decreases in uncompensated care from 2011 to 2015, while Missouri, a non-expansion state, experienced an increase in uncompensated care during this time.
- Compared to other selected Midwestern states, Michigan experienced the largest relative decline in uncompensated care costs from 2011 to 2015.
Health Insurance Coverage Expansions and Uncompensated Care
Several studies have examined the relationship between health insurance coverage expansions and the provision of uncompensated care by hospitals. As part of the Oregon Health Insurance Experiment—a randomized study of the effects of Medicaid coverage on adults—researchers found that a large share of the value of Medicaid spending for new enrollees went to external parties, including health care providers, who were previously providing care without payment.
Other researchers have found that every uninsured patient costs hospitals $900 and that hospital closures increase uncompensated care at nearby hospitals. They also found that increases in uninsured populations cut into profit margins, suggesting that hospitals cannot fully pass along the costs of uncompensated care to insurance companies.
Recent studies have documented the decline in hospital uncompensated care after the ACA’s coverage expansion began in 2014. One study found that state Medicaid expansion was associated with a $2.8 million decrease in uncompensated care per hospital and improved profit margins. Another study found larger uncompensated care reductions for hospitals in Medicaid expansion states that had greater pre-ACA uncompensated care burdens or were located in regions with greater numbers of people who became newly eligible for Medicaid.
Many of these trends continued into 2015. The American Hospital Association (AHA) found that uncompensated care costs for hospitals nationwide decreased from $42.8 billion in 2014 to $35.7 billion in 2015. The ratio of uncompensated care to total expenses also fell substantially and is now the lowest it has been since the AHA began reporting in 1990.
With the reduction in uninsured patients, some hospital systems expanded their qualification rules for charity care to provide assistance to patients with high deductibles and other out-of-pocket costs. In 2016, Ascension Health began waiving unpaid bills for patients with an income below 250 percent of the federal poverty level (FPL) and experienced a 12 percent increase in charity care costs in 2016.
Hospital Uncompensated Care and Financial Trends
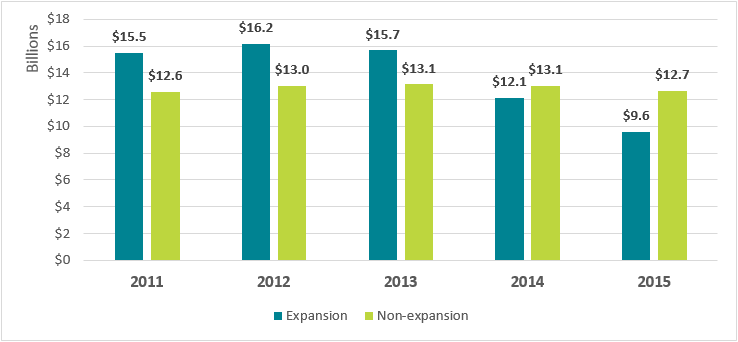
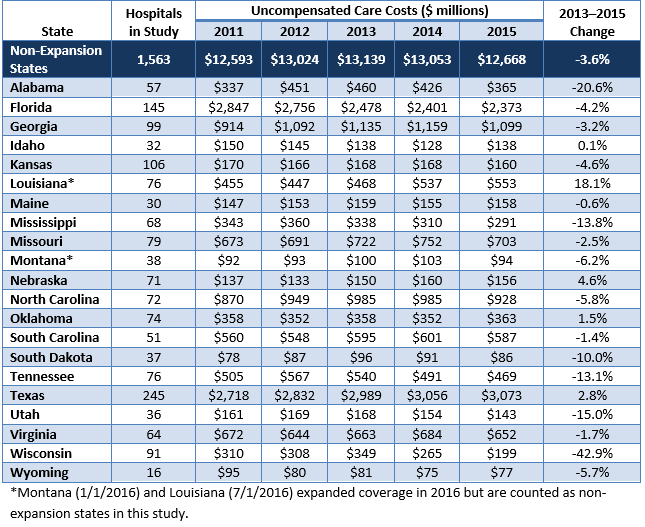
In the present study, CHRT used Medicare cost reports to examine the financial characteristics of 3,474 hospitals across the United States. Based on this data, we found that hospitals provided $28.8 billion in uncompensated care in 2013, prior to the ACA’s coverage expansion (see Figure 1). Beginning in 2013, Medicaid expansion states experienced sharp decreases in uncompensated care, declining by 39 percent by 2015. By comparison, non-expansion states showed a 4 percent decrease, and some states experienced increases in uncompensated care (see Appendix).
Figure 1: Hospital Uncompensated Care Costs for Medicaid Expansion and Non-Expansion States, 2011–2015
Regional Comparison of Uncompensated Care Trends
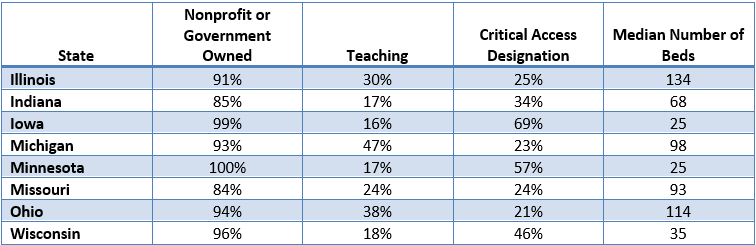
To better understand the connection between coverage expansion and hospital uncompensated care, CHRT compared eight Midwestern states with varying market and policy characteristics. For example, hospitals in Michigan, Ohio, and Illinois were more likely to have a teaching program for the graduate medical education of residents (see Figure 2). Hospitals in Iowa, Minnesota, and Wisconsin were more likely to have a critical access designation as a rural provider and have fewer hospital beds. Missouri and Indiana hospitals were more likely to be part of investor-owned, for-profit companies compared to the other Midwestern states.
Figure 2: Characteristics of Hospitals in Selected Midwestern States
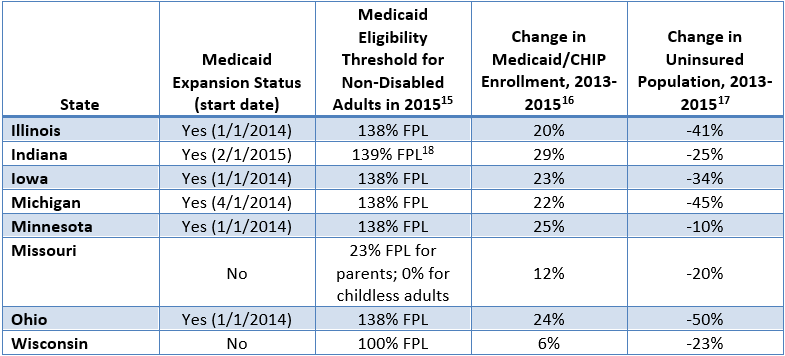
States across the Midwest have taken different approaches to setting Medicaid eligibility for low-income adults. Minnesota took advantage of the ACA’s option for states to expand coverage prior to 2014 and allowed adults with an income less than 75 percent of the FPL to enroll in 2011. Illinois, Iowa, Minnesota, and Ohio then adopted the full Medicaid expansion on January 1, 2014. Indiana and Michigan expanded enrollment on April 1, 2014, and February 1, 2015, respectively (see Figure 3). Illinois, Michigan, and Ohio all experienced a decrease in their uninsured population of over 40 percent from 2013 to 2015.
Neither Missouri nor Wisconsin has expanded Medicaid. However, Wisconsin is the only non-expansion state in the country that does not have a coverage gap for financial assistance.Wisconsin’s Medicaid program covers adults with income up to 100 percent FPL, and adults whose income is above the poverty line are eligible for financial assistance through the health insurance marketplace. In contrast, childless non-disabled adults in Missouri are not eligible for Medicaid, regardless of income level.
Figure 3: Characteristics of Medicaid and Health Insurance Coverage in Selected Midwestern States
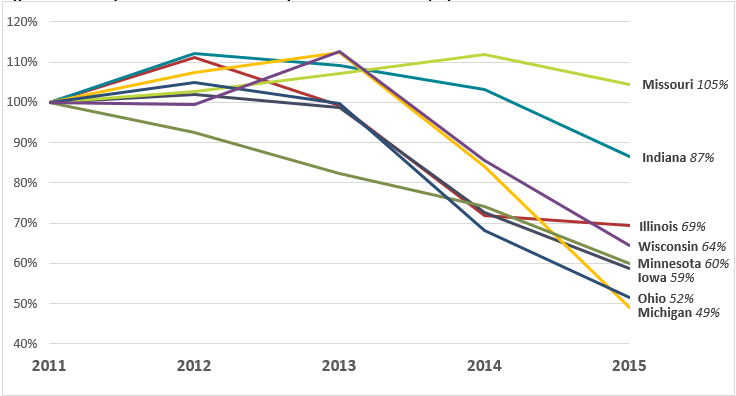
From 2011 to 2015, nearly all of the selected Midwestern states experienced a decrease in hospital uncompensated care costs (see Figure 4). Minnesota, with its early Medicaid expansion, saw uncompensated care decline immediately after 2011. States that expanded in 2014 experienced sharp declines from 2013 to 2014. Indiana, which expanded in early 2015, saw a drop in uncompensated care in 2015 after experiencing rising levels for three straight years from 2011 to 2014. Uncompensated care in Missouri, which did not expand Medicaid, is still above 2011 levels.
Overall, Michigan experienced the largest relative decrease in uncompensated care among the selected Midwestern states, dropping to 49 percent of 2011 levels in 2015. Wisconsin, which did not expand Medicaid but does not have a coverage gap, saw uncompensated care drop to 64 percent of 2011 levels. A study by the Wisconsin Hospital Association found similar declines in uncompensated care, especially from 2013 to 2015.
Figure 4: Uncompensated Care Costs Compared to 2011 Levels, by State
Conclusion
Medicaid expansion states have continued to experience large declines in hospital uncompensated care costs since 2014. As debate among state and federal policymakers about the future of the Affordable Care Act continues, it will be important to examine the connection between health insurance coverage expansions and financial outcomes for health care providers. Not all hospitals experienced the same effects of coverage expansion on uncompensated care, and it is not clear how hospitals would respond to policy changes that reduce the coverage gains under the ACA or the value of coverage to those who became newly insured.
Data and Methodology
We extracted hospital data on uncompensated care and other facility characteristics from publicly available cost reports submitted by hospitals to the Centers for Medicare and Medicaid Services (CMS) via the Healthcare Cost Report Information System (HCRIS). Data include reports collected by December 31, 2016, which were released on January 19, 2017. For this analysis, we restricted the set of hospitals to short-term acute and critical access hospitals that submitted complete reports for each year from 2011 through 2014. This eliminated rehabilitation, long-term, psychiatric, children’s, and other specialty hospitals that have high nonresponse rates or are not largely affected the ACA’s Medicaid expansion. The resulting data set includes 3,474 hospitals nationwide.
Hospitals submit worksheet S-10 as part of their cost report that breaks down their uncompensated care costs into their separate sources. In our analysis, we define uncompensated care as the sum of charity care (care delivered with no expectation of payment) and bad debt (care that is billed but no payment is received), but underpayments from public payers (Medicare, Medicaid, and the Children’s Health Insurance Program) were excluded. The use of cost report data for uncompensated care research is still relatively new, and not all responses from hospitals are audited by CMS. However, MedPAC has supported using worksheet S-10 to directly measure uncompensated care costs. Data for inpatient days and outpatient visits were extracted from worksheet S-3, part 1, and data on operating margins were extracted from worksheet G-3 of the cost reports.
Cost reports submitted to hospitals are based on individual hospitals’ fiscal years, which have varying beginning and end dates. To generate comparable time-series measures, we converted hospital fiscal year measures to calendar year estimates by combining the portion of each fiscal year that fell within a given calendar year. Uncompensated care amounts were converted from charges to costs using hospital-specific cost-to-charge ratios calculated in the cost reports, and all financial measures were adjusted for inflation to 2014 dollars. Facilities that reported outlier uncompensated care amounts compared to their historic trend were dropped from the study.
Hospitals were identified as for-profit, nonprofit, or government-owned based on control status data from the 2013 American Hospital Association annual survey. Metropolitan status was determined based on the U.S. Department of Agriculture’s rural-urban continuum codes for 2013, and hospitals were identified as teaching institutions if they indicated in their cost reports that they train residents as part of an approved graduate medical education program.
Appendix
Figure A-1: Uncompensated Care Trends in the United States, 2011–2015
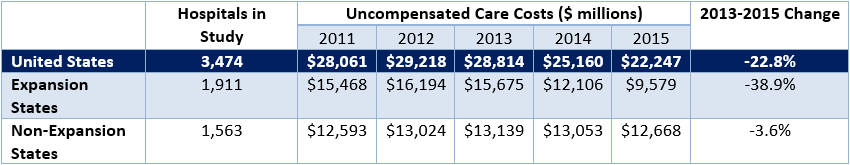
Figure A-2: Uncompensated Care Trends by State, Medicaid Expansion States, 2011–2015
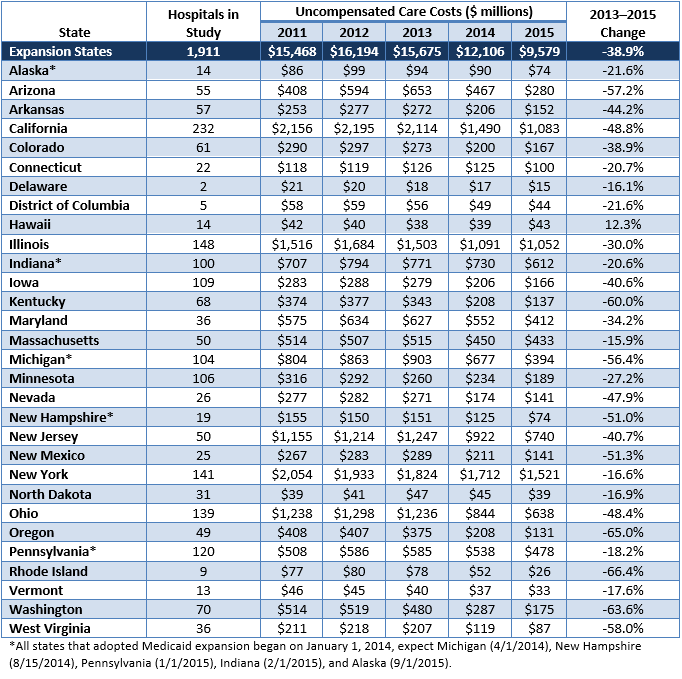
Figure A-3: Uncompensated Care Trends by State, Non-Expansion States, 2011–2015

 In July 2017, the United States Senate rejected a series of proposals to repeal and replace the Affordable Care Act (ACA). On September 13, 2017, Senators Lindsey Graham and Bill Cassidy introduced a new proposal to repeal and replace the ACA.
 The Affordable Care Act (ACA) allowed states to expand Medicaid coverage to low-income childless adults, many of whom receive specialty mental health and substance use services through community mental health systems. Leading up to the passage of the ACA, community mental health providers and their professional associations were generally supportive of expanding Medicaid under the ACA. Medicaid covers specialty services central to quality mental health and substance use care, as well as other physical health services that many in the serious mental illness (SMI) and substance use disorder (SUD) populations lacked before 2010. This brief examines the impact of the ACA Medicaid expansion on community mental health.


 Health plans are now determining whether to offer coverage in the Marketplace this fall and if so, which products and rates to offer. While there is
 The Affordable Care Act (ACA) not only significantly expanded access coverage starting in 2014, but also sought to improve access to services by reducing cost barriers to care and requiring coverage of certain “essential benefits”. For example, the ACA established patient annual out-of-pocket cost maximums; eliminated patient cost sharing for certain preventive care services; and prohibited annual and lifetime limits on benefits. The ACA expanded access to coverage primarily in the individual market through the Health Insurance Marketplace and by expanding Medicaid based on household income.
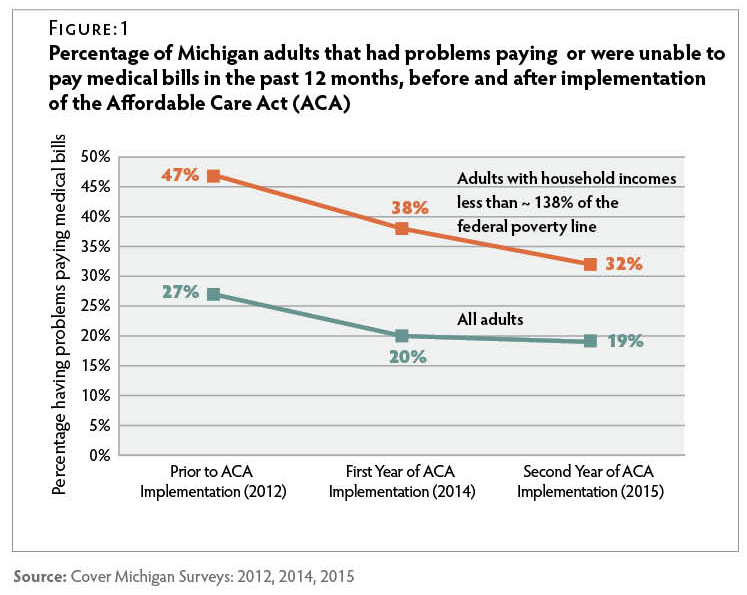
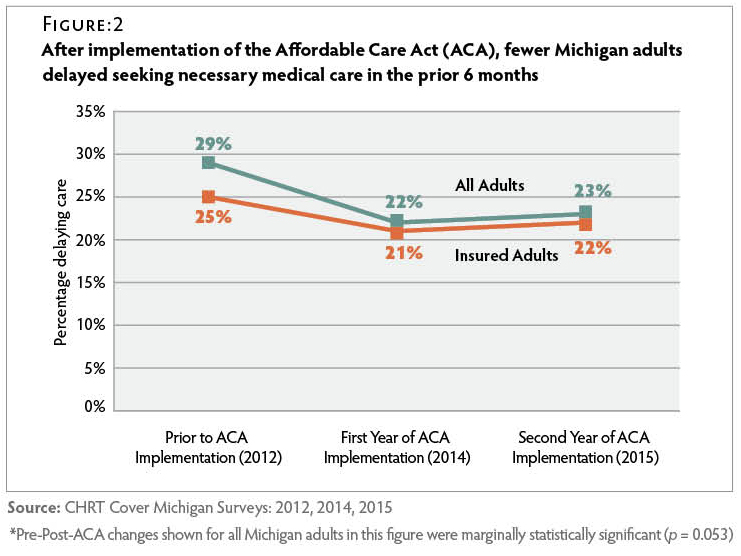
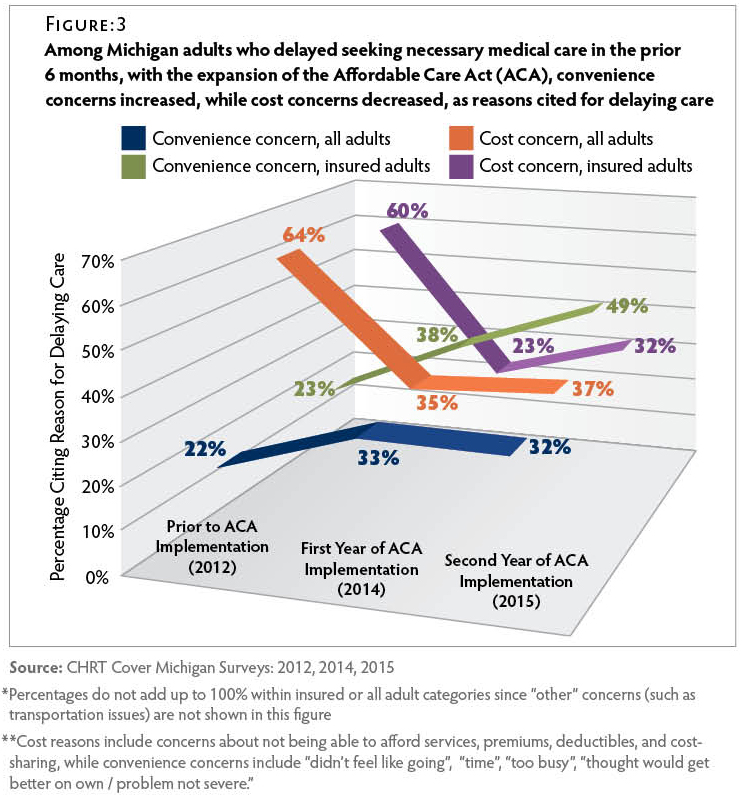

 Data from the Center for Healthcare Research and Transformation’s (CHRT) Cover Michigan Survey describes the rate of satisfaction with health care coverage before and after implementation of the Patient Protection and Affordable Care Act (ACA).
 No single replacement for the Affordable Care Act (ACA) has yet emerged. However, there are several ideas that seem to have considerable support among those in health care leadership roles in President Trump’s Administration and Congress.