Publications

Comparing Recent Health Care Proposals: From building on the ACA to Medicare for All

Yellow road sign reading "Health insurance changes ahead", referring to the changes to the Healthy Michigan Plan.

A yellow road sign reading, "Health insurance changes ahead," indicating changes due to the health care proposals the author is comparing.Democratic lawmakers in Congress have made a variety of proposals to strengthen or reform the United States health care system. These proposals range from building upon the Affordable Care Act (ACA) to fully transitioning the U.S. to a single-payer system. This fact sheet categorizes and compares the major provisions of these proposals, including possible implications for consumers, health care providers, and federal and state governments.

The proposals that the fact sheet compares are: ACA 2.0, which increases Marketplace financial assistance, restores outreach and assistance funding, and creates a reinsurance program; Public Option, which creates a publicly-administered health insurance plan offered for purchase on the Marketplace; Medicaid Buy-In, which provides certain individuals with the opportunity to purchase Medicaid coverage; Medicare Buy-In, which provides certain individuals with the opportunity to purchase Medicare coverage; Medicare for America, which provides an option and incentives for all US citizens to switch to Medicare coverage; and Medicare for All, which replaces the current health insurance system with universal Medicare coverage for all U.S. citizens.

For each health care proposal, the sheet considers who would be affected, what would be covered, what cost-sharing would look like, how it would impact other types of coverage, how it could impact health care providers, how it would be financed, and how much it could cost. The fact sheet also lists the specific bills and proposals for each health care option.

This fact sheet combines information on all the recent health care proposals in a straightforward, objective format so the proposals can easily be compared and considered. 

READ THE REPORT

Health Insurance Marketplace 2019: Rate Analysis

Financial Graph

A hand holds a pen over a colorful chart with a calculator nearby, indicating the rate analysis of the health insurance marketplace.The health insurance marketplaces created under the Affordable Care Act (ACA) have weathered several years of volatility and uncertainty. Following a tumultuous 2017 marked by Congressional “repeal and replace” debates, important administrative changes, and the termination of cost-sharing reduction payments to insurers, Michigan and other states experienced steep premium increases for 2018.

One year later, premiums in Michigan’s Health Insurance Marketplace have stabilized, with increases for 2019 far lower than they have been in recent years. Michigan also experienced its first new insurer entering the market since 2015.

With financial assistance tied to premium levels, low premium increases for 2019 mean that some individuals will experience changes in the amount of financial assistance they receive to purchase Marketplace coverage, so consumers should compare plan options, pricing, and benefits carefully to find coverage that meets their needs.

Key findings of our 2019 health insurance marketplace rate analysis include:

  • Premium increases for 2019 are substantially lower than premium increases in 2018. Across all counties, the average premium increase for the lowest cost and second-lowest cost silver plans is 0.6 percent and 1.5 percent, respectively. Premiums for the lowest cost bronze plan increased by 1.5 percent, and premiums for the lowest cost gold plan decreased by 0.2 percent.
  • Michigan continues to have a robust Marketplace. Nine insurers are participating in the health insurance marketplace in 2019, an increase of one from 2018. The new insurer, Oscar Insurance Company, offers coverage in five Southeast Michigan counties. All of Michigan’s 83 counties have at least two participating carriers.
  • Michigan consumers can select from a variety of Marketplace plans. There are 12 to 57 plans offered in each of Michigan’s 83 counties.
  • The 2019 Marketplace Open Enrollment Period remains the same length as it was for 2018: 45 days, beginning November 1 and ending December 15.
  • Federal financial support for Michigan Navigators to help with open enrollment has been reduced by 51 percent, from $627,958 in 2018 to $309,111 in 2019.
  • This is the second year in a row of substantial funding reductions for the Navigator program: from 2017 to 2018, Michigan’s Navigator funding decreased by 72 percent, from $2,228,692 in 2017 to $627,958 in 2018.

READ THE REPORT

Michigan at a crossroads: CHRT highlights key health policy issues for the incoming gubernatorial administration

Two feet standing on a road, with a red stripe going one direction and a yellow stripe going the other direction, showing how Michigan health policy issues are at a crossroads.The Michigan government has jurisdiction over a wide array of health policy issues. From the regulation of insurance products, to oversight of the state’s Medicaid program, to investing in local public health efforts, Michigan policymakers craft policies and budgets that impact the health of millions of Michiganders.

This brief provides an overview of four key and timely health policy topics:

  • Medicaid and the Healthy Michigan Plan;
  • the individual health insurance market and the federal Health Insurance Marketplace;
  • the opioid epidemic; and
  • the integration of services to address the social determinants of health.

With the expansion of Medicaid and the launch of the Affordable Care Act’s individual Health Insurance Marketplace, the numbers of uninsured Michiganders have been considerably reduced since 2013. Yet Michigan policy makers will still face numerous policy issues and decisions related to health care coverage, health disparities, and access to care in the years to come. Our state will continue to struggle with complex health issues such as substance use and access to mental health services.

Michigan policy leaders, local public health agencies, and the private sector are engaged in many innovative initiatives to address these issues and improve the health of communities. In particular, the state has committed to programs that are intended to improve health equity and focus on the social determinants of health.

All of this work is being conducted at a time of great political change and considerable turmoil at the federal level. The new governor and the 100th Legislature will be faced with both tremendous responsibility and opportunity to shape the health policy landscape for years to come.

READ THE BRIEF

Health Insurance Marketplace in Michigan 2018: Rate Analysis

health

Screenshot of the healthcare.gov website, location of the Health Insurance Marketplace

In 2017, the federal government took several regulatory and administrative actions that affect the health insurance marketplaces created under the Affordable Care Act (ACA). At the same time that Congress considered legislative proposals to repeal and replace the ACA, the U.S. Department of Health and Human Services (HHS) promulgated new regulations that changed annual open enrollment dates and announced the end of cost-sharing reduction payments to insurers. These developments, in addition to several other factors, have impacted Marketplace carrier participation and plan pricing in Michigan. This brief analyzes the rates in the 2018 Health Insurance Marketplace in Michigan.

Key findings include:

  • Michigan continues to have a robust Marketplace. Eight insurers are participating in Michigan’s health insurance marketplace in 2018, a decrease of two insurers from 2017.
  • Michigan consumers can select from a variety of Marketplace plans. There are 12 to 52 plans offered in each of Michigan’s 83 counties.
  • Across all counties, the average premium increase for the lowest cost and second-lowest cost silver plans is 33 percent and 34 percent, respectively. Premiums for the lowest cost bronze plan increased by 16 percent, and premiums for the lowest cost gold plan increased by 6 percent.
  • Premium tax credits are linked to the cost of the local second-lowest cost silver plan. All else equal, individuals who are eligible for premium tax credits could receive a larger tax credit in 2018 due to premium increases for the second-lowest cost silver plan. In 23 counties, larger tax credit amounts will eliminate the cost difference between renewing the 2017 lowest cost silver plan and actively enrolling in the 2018 lowest cost silver plan.
  • The federal government reduced the open enrollment period to 45 days, from 92 days in 2017.
  • Federal financial support for Michigan Navigators to help with open enrollment has been reduced by 72 percent, from $2,228,692 in 2017 to $627,958 in 2018.

READ THE BRIEF

The impact of the ACA on community mental health and substance abuse services: Experience in three Great Lakes states

Image of the great lakes, with blue lakes on a white background.The Affordable Care Act (ACA) allowed states to expand Medicaid coverage to low-income childless adults, many of whom receive specialty mental health and substance use services through community mental health systems.  Leading up to the passage of the ACA, community mental health providers and their professional associations were generally supportive of expanding Medicaid under the ACA.  Medicaid covers specialty services central to quality mental health and substance use care, as well as other physical health services that many in the serious mental illness (SMI) and substance use disorder (SUD) populations lacked before 2010. This brief examines the impact of the ACA Medicaid expansion on community mental health.

To date, 32 states have expanded Medicaid (including the District of Columbia), while the remaining 19 have not.  This brief, which was developed with support from the Commonwealth Fund, examines the impact of the ACA on public mental health and substance use systems in three Midwestern states: Michigan and Indiana, both Medicaid expansion states, and Wisconsin, a non-expansion state.

The experience from these three states suggests that Medicaid expansion has had an important and overall beneficial effect in particular for the substance use population.  The favorable impact is particularly important in light of the opioid epidemic.

Key findings include:

  • Prior to the Medicaid expansion, state and local funds paid for many services for the SMI/serious emotional disturbance (SED) and SUD populations. In Medicaid expansion states, most funding shifted to the federal government, providing both advantages and disadvantages: more people in need received insurance coverage, but that coverage was less flexible for SMI/SED populations than prior funding mechanisms.
  • Funding for substance use services improved substantially in Medicaid expansion states, serving a particularly important role in enabling states to provide more services in the wake of the opioid crisis. In these states, many more individuals had Medicaid SUD treatment benefits than before expansion and federal block grant funds were freed up to provide additional substance use services. As a result of the additional funding provided, Michigan was able to increase the numbers of those who received SUD care by 14%.

READ THE BRIEF

Decrease in Hospital Uncompensated Care in Michigan, 2015

The Affordable Care Act (ACA) expanded access to health insurance coverage for Michigan residents in 2014 through the creation of the Health Insurance Marketplace and the expansion of the Medicaid program. Since then, Michigan has experienced large decreases in the number of adults who lack health insurance, delay necessary care, and have trouble paying their medical bills.(1)E. Austic, E. Lawton, M. Slowey, M. Riba, and M. Udow-Phillips, Changes in Health Care Cost Barriers under the Affordable Care Act in Michigan (Ann Arbor, MI: Center for Healthcare Research and Transformation, 2017). Hospitals also appear to have reaped the benefits of the ACA’s coverage expansions. Following the expansion of Michigan’s Medicaid program in April 2014, Michigan hospitals experienced a steep drop in uncompensated care costs. In 2015, uncompensated care costs continued to decline, and as uncompensated care’s share of hospital operating expenses decreased, the median hospital operating margin in Michigan improved for the second year in a row. As policymakers debate changes to the Affordable Care Act and Medicaid, it is important to assess the financial gains that Michigan hospitals have received in the first two years of ACA implementation and the potential losses they could incur with a repeal of the ACA.

For an analysis of uncompensated care costs nationwide and a comparison of these trends in several Midwestern states, please see CHRT’s companion piece, Hospital Uncompensated Care in the United States, 2015 – Comparison of Midwest States.

Hospital Uncompensated Care and Financial Trends

Recent studies have documented decreases in uncompensated care and the proportion of uninsured patients in Michigan hospitals after the ACA’s coverage expansion began in 2014. One study used Medicaid cost reports to find that uncompensated care costs for 88 Michigan hospitals(2)88 hospitals in the state of Michigan reported FY2015 data at the time of the study. decreased from $627 million in 2013 to $332.1 million in 2015.(3)T. Buchmueller, H. Levy, S. Nikpay, and J. Rhodes, Healthy Michigan Plan 2015 Report on Uncompensated Care and Insurance Rates, prepared for the Michigan Department of Health and Human Services, December 31, 2016 (accessed 6/12/17).

Another study examined shifts in payer mix in Michigan hospitals following the launch of the Healthy Michigan Plan in April 2014. This study found that the proportion of uninsured patients in Michigan hospitals from April-December 2014 decreased by four percentage points and the proportion of patients with Medicaid coverage increased by 6.5 percentage points compared to the same time periods in 2012 and 2013.(4)M. Davis, A. Gebremariam, and J. Ayanian, “Changes in Insurance Coverage Among Hospitalizeds Nonelderly Adults After Medicaid Expansion in Michigan,” Journal of the American Medical Association, June 21, 2016 (accessed 6/12/17).

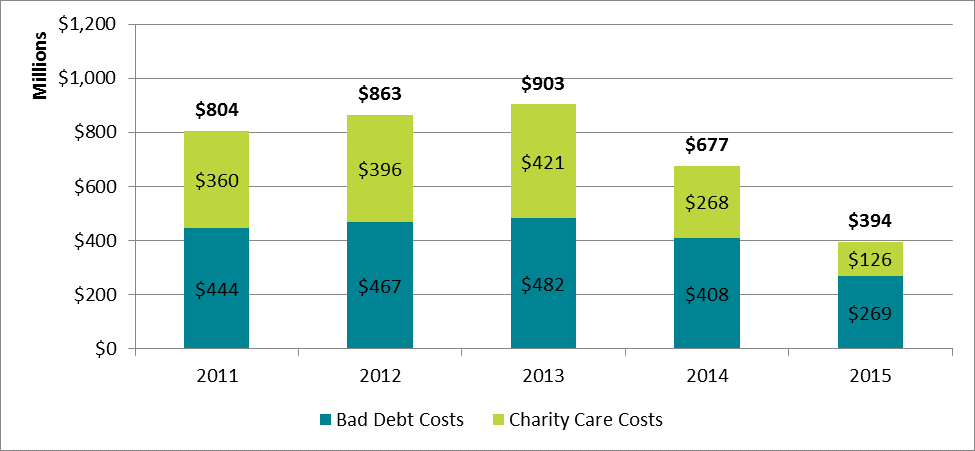
In the present study, CHRT used Medicare cost reports to examine the financial characteristics of 104 hospitals in Michigan. Michigan expanded Medicaid eligibility with the launch of the Healthy Michigan Plan on April 1, 2014. By the end of the year Michigan experienced a sharp decline in uncompensated care, dropping from $903 million in 2013 to $677 million in 2014 (see Figure 1). This drop continued into 2015 as uncompensated care fell to $394 million, a decrease of 56 percent from 2013 levels.

Uncompensated care comprises both charity care costs and bad debt costs. The effect of the Medicaid expansion was larger for the charity care portion of uncompensated care compared to the bad debt portion. Charity care expenses for hospitals decreased by 70 percent from 2013 to 2015.

Figure 1: Hospital Uncompensated Care Costs in Michigan, by Bad Debt and Charity Care, 2011–2015

Figure 1: Hospital Uncompensated Care Costs in Michigan, by Bad Debt and Charity Care, 2011–2015

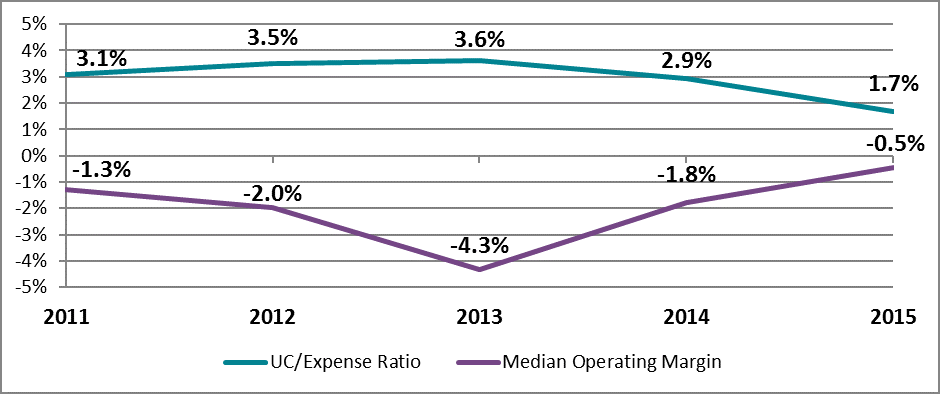
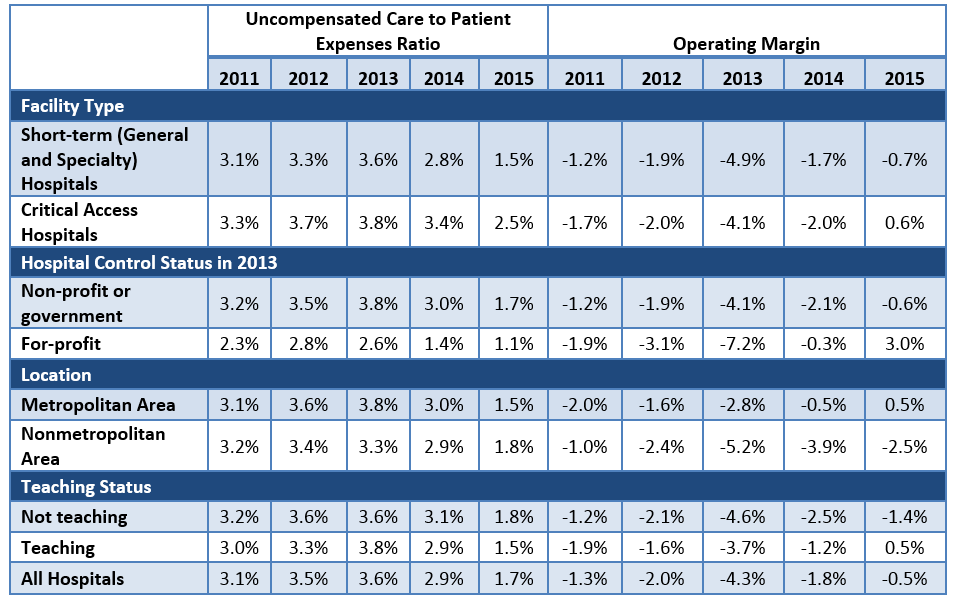
From 2013 to 2015, Michigan hospitals generally experienced improved overall financial outcomes as well as decreased uncompensated care burdens. Uncompensated care’s share of hospital expenses fell from 3.6 percent for the median hospital in 2013 to 1.7 percent in 2015 after increasing in the years prior to Medicaid expansion (see Figure 2). However, hospitals had different levels of uncompensated care burdens and the effects of coverage expansion varied by specific hospital characteristics (see Appendix).

Coinciding with the decline in uncompensated care costs, the median hospital operating margin (net profits from patient care services) increased from -4.3 percent in 2013 to -0.5 percent in 2015. The ACA includes several quality improvement programs, such as penalties for hospital readmissions, which affect Medicare reimbursement. While these types of penalties may have had a negative effect on the profitability of certain hospitals, many hospitals experienced substantial gains in profitability in 2015.

Figure 2: Median Hospital Financial Indicators in Michigan, 2011–2015

Figure 2: Median Hospital Financial Indicators in Michigan, 2011–2015

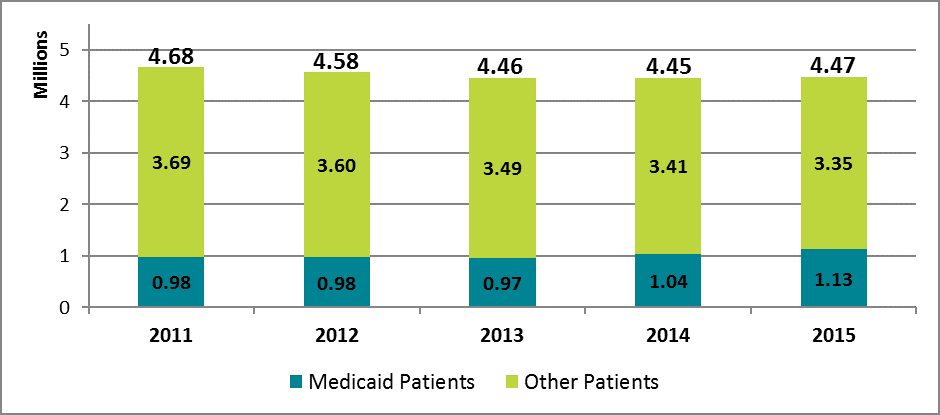
From 2011 to 2013 the number of inpatient days and outpatient visits at Michigan hospitals decreased from 4.68 million to 4.46 million (see Figure 3). In 2015, Medicaid volume increased by 16 percent to 1.13 million inpatient days and outpatient visits, while volume for other payers decreased by 4 percent. Overall volume has remained nearly unchanged from 2013 to 2015. Medicaid’s share of total patient volume increased from 21.7 percent in 2013 to 25.2 percent in 2015.

Figure 3: Hospital Inpatient Days and Outpatient Visits for Michigan Hospitals by Payer, 2011–2015

Figure 3: Hospital Inpatient Days and Outpatient Visits for Michigan Hospitals by Payer, 2011–2015

Conclusion

Hospital financial performance in Michigan has improved in the two years since the implementation of the ACA’s coverage expansions in 2014. Michigan continued to experience a decline in hospital uncompensated care costs in 2015 as hospitals saw fewer uninsured patients and a higher proportion of patients covered by Medicaid. Overall hospital operating margins also improved in 2015. Medicaid expansion appears to have had a positive effect on hospitals’ uncompensated care costs and overall margins since the launch of the Healthy Michigan Plan in 2014. With policymakers currently debating changes to Medicaid and the future of the Affordable Care Act, it will be important to monitor the connection between the coverage expansions created under the law and the financial performance of health care providers. Policy changes that reverse the ACA’s coverage gains could also affect hospitals’ financial status.

Data and Methodology

We extracted hospital data on uncompensated care and other facility characteristics from publicly available cost reports submitted by hospitals to the Centers for Medicare and Medicaid Services (CMS) via the Healthcare Cost Report Information System (HCRIS). Data include reports collected by December 31, 2016, which were released on January 19, 2017. For this analysis, we restricted the set of hospitals to short-term acute and critical access hospitals that submitted complete reports for each year from 2011 through 2015. This eliminated rehabilitation, long-term, psychiatric, children’s, and other specialty hospitals that have high nonresponse rates or are not largely affected the ACA’s Medicaid expansion. The resulting data set includes 3,474 hospitals nationwide and 104 in Michigan.

Hospitals submit worksheet S-10 as part of their cost report that breaks down their uncompensated care costs into their separate sources. In our analysis, we define uncompensated care as the sum of charity care (care delivered with no expectation of payment) and bad debt (care that is billed but no payment is received), but underpayments from public payers (Medicare, Medicaid, and the Children’s Health Insurance Program) were excluded. The use of cost report data for uncompensated care research is still relatively new, and not all responses from hospitals are audited by CMS. However, MedPAC has supported using worksheet S-10 to directly measure uncompensated care costs.(5)Medicare Payment Advisory Commission. Report to the Congress: Medicare Payment Policy. March 2016. http://www.medpac.gov/docs/default-source/reports/march-2016-report-to-the-congress-medicare-payment-policy.pdf (accessed 3/17/16). Data for inpatient days and outpatient visits were extracted from worksheet S-3, part 1, and data on operating margins were extracted from worksheet G-3 of the cost reports.

Cost reports submitted to hospitals are based on individual hospitals’ fiscal years, which have varying beginning and end dates. To generate comparable time-series measures, we converted hospital fiscal year measures to calendar year estimates by combining the portion of each fiscal year that fell within a given calendar year. Uncompensated care amounts were converted from charges to costs using hospital-specific cost-to-charge ratios calculated in the cost reports, and all financial measures were adjusted for inflation to 2015 dollars. Facilities that reported outlier uncompensated care amounts compared to their historic trend were dropped from the study.

Hospitals were identified as for-profit, nonprofit, or government-owned based on control status data from the 2013 American Hospital Association annual survey.(6)American Hospital Association. Annual Survey Database: http://www.aha.org/research/rc/stat-studies/data-and-directories.shtml (accessed 3/17/16). Metropolitan status was determined based on the U.S. Department of Agriculture’s rural-urban continuum codes for 2013,(7)US Department of Agriculture, Economic Research Service, Rural-Urban Continuum Codes: http://www.ers.usda.gov/data-products/rural-urban-continuum-codes.aspx (accessed 3/17/16). and hospitals were identified as teaching institutions if they indicated in their cost reports that they train residents as part of an approved graduate medical education program.

Appendix

Figure A-1: Median Financial Indicators for Michigan Hospitals by Select Characteristics, 2011–2015

Figure A-1: Median Financial Indicators for Michigan Hospitals by Select Characteristics, 2011–2015


References

References
1 E. Austic, E. Lawton, M. Slowey, M. Riba, and M. Udow-Phillips, Changes in Health Care Cost Barriers under the Affordable Care Act in Michigan (Ann Arbor, MI: Center for Healthcare Research and Transformation, 2017).
2 88 hospitals in the state of Michigan reported FY2015 data at the time of the study.
3 T. Buchmueller, H. Levy, S. Nikpay, and J. Rhodes, Healthy Michigan Plan 2015 Report on Uncompensated Care and Insurance Rates, prepared for the Michigan Department of Health and Human Services, December 31, 2016 (accessed 6/12/17).
4 M. Davis, A. Gebremariam, and J. Ayanian, “Changes in Insurance Coverage Among Hospitalizeds Nonelderly Adults After Medicaid Expansion in Michigan,” Journal of the American Medical Association, June 21, 2016 (accessed 6/12/17).
5 Medicare Payment Advisory Commission. Report to the Congress: Medicare Payment Policy. March 2016. http://www.medpac.gov/docs/default-source/reports/march-2016-report-to-the-congress-medicare-payment-policy.pdf (accessed 3/17/16).
6 American Hospital Association. Annual Survey Database: http://www.aha.org/research/rc/stat-studies/data-and-directories.shtml (accessed 3/17/16).
7 US Department of Agriculture, Economic Research Service, Rural-Urban Continuum Codes: http://www.ers.usda.gov/data-products/rural-urban-continuum-codes.aspx (accessed 3/17/16).

Hospital Uncompensated Care in the United States, 2015 – Comparison of Midwest States

Hospital doctor sits at a desk with a laptop, clipboard, and phone.Since the launch of health insurance coverage expansion in 2014 under the Affordable Care Act (ACA), Michigan and other states have experienced large decreases in the number of adults who lack health insurance, delay necessary care, and have trouble paying their medical bills.(1) Austic, E. Lawton, M. Slowey, M. Riba, and M. Udow-Phillips, Changes in Health Care Cost Barriers under the Affordable Care Act in Michigan (Ann Arbor, MI: Center for Healthcare Research and Transformation, March 2017). However, these effects have not been even nationwide, as 21 states had not adopted the ACA’s optional Medicaid expansion by the end of 2015.(2) Dussault, M. Pinkovskiy, and B. Zafar, “Is Health Insurance Good for Your Financial Health?” Liberty Street Economics, June 6, 2016: http://libertystreeteconomics.newyorkfed.org/2016/06/is-health-insurance-good-for-your-financial-health.html (accessed 3/10/17). Hospitals are particularly affected by health insurance coverage expansions because many hospitals have traditionally provided free and/or reduced price services to low-income and uninsured patients as part of their social mission and community benefit requirements. Prior to the ACA coverage expansion, health care providers, including hospitals, provided approximately $1,000 of uncompensated care per uninsured individual.(3)T. A. Coughlin et al.,  “An Estimated $84.9 Billion in Uncompensated Care Was Provided in 2013; ACA Payment Cuts Could Challenge Providers,” Health Affairs, May 2014, 33(5): 807–14: http://content.healthaffairs.org/content/33/5/807.full (accessed 3/10/17).(accessed 3/10/17). This report examines the effect of health care expansion on hospital uncompensated care with a comparison of Midwest states.

Hospitals have two forms of uncompensated care: charity care and bad debt.(4) Broader definitions of uncompensated care may include underpayments from Medicare and Medicaid, but underpayments were not included in this analysis.  Charity care is delivered to indigent patients without the expectation of receiving payment, and bad debt occurs when a hospital bills for but is unable to collect the entire amount due from a patient.(5) Hospitals have different procedures and qualifications for how patients can apply for charity care assistance, which limits the comparison of charity care and bad debt measures across hospitals.This report updates an earlier CHRT report(6) Fangmeier and M. Udow-Phillips, “Hospital Uncompensated Care, 2014,” Cover Michigan 2016 (Ann Arbor, MI: Center for Healthcare Research and Transformation, 2016). to measure the effect of the ACA’s coverage expansion, particularly the optional Medicaid expansion, on hospital uncompensated care costs and other financial outcomes. In addition, this report compares trends in uncompensated care across eight selected Midwestern states.

Key Findings

  • Uncompensated care costs for hospitals decreased by about 23 percent nationwide from 2013 to 2015, but hospitals in Medicaid expansion states experienced much sharper deceases (39 percent) than those in non-expansion states (4 percent).
  • Almost all selected states in the Midwest experienced decreases in uncompensated care from 2011 to 2015, while Missouri, a non-expansion state, experienced an increase in uncompensated care during this time.
  • Compared to other selected Midwestern states, Michigan experienced the largest relative decline in uncompensated care costs from 2011 to 2015.

Health Insurance Coverage Expansions and Uncompensated Care

Several studies have examined the relationship between health insurance coverage expansions and the provision of uncompensated care by hospitals. As part of the Oregon Health Insurance Experiment—a randomized study of the effects of Medicaid coverage on adults—researchers found that a large share of the value of Medicaid spending for new enrollees went to external parties, including health care providers, who were previously providing care without payment.(7)A. Finkelstein, N. Hendren, and E.  Luttmer, “The Value of Medicaid: Interpreting Results from the Oregon Health Insurance Experiment,” NBER Working  Paper 21308 (Cambridge, MA: National Bureau of Economic Research, June 2015): http://www.nber.org/papers/w21308 (accessed 3/10/17).

Other researchers have found that every uninsured patient costs hospitals $900 and that hospital closures increase uncompensated care at nearby hospitals. They also found that increases in uninsured populations cut into profit margins, suggesting that hospitals cannot fully pass along the costs of uncompensated care to insurance companies.(8)C. Garthwaite, T. Gross, and M. Notowidigdo, “Hospitals as Insurers of Last Resort,” NBER Working Paper 21290 (Cambridge, MA: National Bureau of Economic Research, June 2015): http://www.nber.org/papers/w21290 (accessed 3/10/17).

Recent studies have documented the decline in hospital uncompensated care after the ACA’s coverage expansion began in 2014. One study found that state Medicaid expansion was associated with a $2.8 million decrease in uncompensated care per hospital and improved profit margins.(9)F. Blavin, “Association Between the 2014 Medicaid Expansion and US Hospital Finances,” Journal of the American Medical Association, Oct. 11, 2016, 316(14): 1475–83.2016: http://jamanetwork.com/journals/jama/fullarticle/2565750 (accessed 3/10/17). Another study found larger uncompensated care reductions for hospitals in Medicaid expansion states that had greater pre-ACA uncompensated care burdens or were located in regions with greater numbers of people who became newly eligible for Medicaid.(10)D. Dranove, C. Garthwaite, and C. Ody, “Uncompensated Care Decreased at Hospitals in Medicaid Expansion States But Not at Hospitals in Nonexpansion States,” Health Affairs, Aug. 2016, 35(8): 1471–9: http://content.healthaffairs.org/content/35/8/1471.abstract (accessed 3/10/17).

Many of these trends continued into 2015. The American Hospital Association (AHA) found that uncompensated care costs for hospitals nationwide decreased from $42.8 billion in 2014 to $35.7 billion in 2015. The ratio of uncompensated care to total expenses also fell substantially and is now the lowest it has been since the AHA began reporting in 1990.(11)American Hospital Association, Uncompensated Hospital Care Cost Fact Sheet, December 2016:  http://www.aha.org/content/16/uncompensatedcarefactsheet.pdf (accessed 3/10/2017).

With the reduction in uninsured patients, some hospital systems expanded their qualification rules for charity care to provide assistance to patients with high deductibles and other out-of-pocket costs. In 2016, Ascension Health began waiving unpaid bills for patients with an income below 250 percent of the federal poverty level (FPL) and experienced a 12 percent increase in charity care costs in 2016.(12)Ascension. Management’s Discussion and Analysis of Financial Condition and Results of Operations for Ascension, n.d.:  http://ascension.org/~/media/files/ascension/about/community-investor-relations/2017/management-discussion-q2-2017.pdf?la=en (accessed 3/10/2017).

Hospital Uncompensated Care and Financial Trends

In the present study, CHRT used Medicare cost reports to examine the financial characteristics of 3,474 hospitals across the United States. Based on this data, we found that hospitals provided $28.8 billion in uncompensated care in 2013, prior to the ACA’s coverage expansion (see Figure 1). Beginning in 2013, Medicaid expansion states experienced sharp decreases in uncompensated care, declining by 39 percent by 2015. By comparison, non-expansion states showed a 4 percent decrease, and some states experienced increases in uncompensated care (see Appendix).

Figure 1: Hospital Uncompensated Care Costs for Medicaid Expansion and Non-Expansion States, 2011–2015
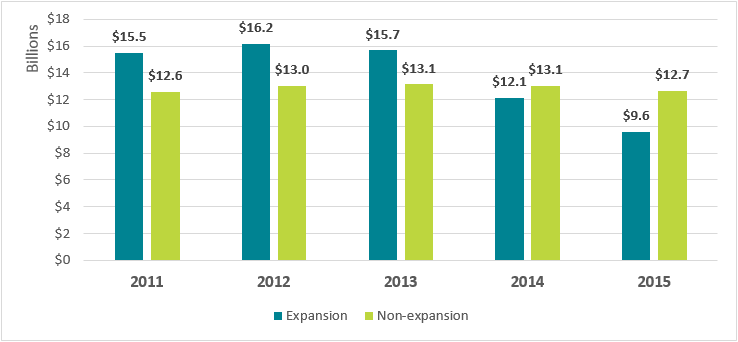
Figure 1: Hospital Uncompensated Care Costs for Medicaid Expansion and Non-Expansion States, 2011–2015

Regional Comparison of Uncompensated Care Trends

To better understand the connection between coverage expansion and hospital uncompensated care, CHRT compared eight Midwestern states with varying market and policy characteristics. For example, hospitals in Michigan, Ohio, and Illinois were more likely to have a teaching program for the graduate medical education of residents (see Figure 2). Hospitals in Iowa, Minnesota, and Wisconsin were more likely to have a critical access designation as a rural provider and have fewer hospital beds. Missouri and Indiana hospitals were more likely to be part of investor-owned, for-profit companies compared to the other Midwestern states.

Figure 2: Characteristics of Hospitals in Selected Midwestern States

Figure 2: Characteristics of Hospitals in Selected Midwestern States

States across the Midwest have taken different approaches to setting Medicaid eligibility for low-income adults. Minnesota took advantage of the ACA’s option for states to expand coverage prior to 2014 and allowed adults with an income less than 75 percent of the FPL to enroll in 2011.(13)Sommers, G. Kenney and A. Epstein, “New Evidence On The Affordable Care Act: Coverage Impacts Of Early Medicaid Expansions”, Health Affairs, Jan. 2014, 33(1):78–87: http://content.healthaffairs.org/content/33/1/78.full (accessed 3/10/17).

Illinois, Iowa, Minnesota, and Ohio then adopted the full Medicaid expansion on January 1, 2014. Indiana and Michigan expanded enrollment on April 1, 2014, and February 1, 2015, respectively (see Figure 3). Illinois, Michigan, and Ohio all experienced a decrease in their uninsured population of over 40 percent from 2013 to 2015.

Neither Missouri nor Wisconsin has expanded Medicaid. However, Wisconsin is the only non-expansion state in the country that does not have a coverage gap for financial assistance.(14)Adults with incomes below 100 percent FPL in all other non-expansion states fall into a coverage gap because they are ineligible for Medicaid coverage, and tax credits to purchase coverage on the health insurance marketplace are only available to those with incomes above 100 percent FPL.Wisconsin’s Medicaid program covers adults with income up to 100 percent FPL, and adults whose income is above the poverty line are eligible for financial assistance through the health insurance marketplace. In contrast, childless non-disabled adults in Missouri are not eligible for Medicaid, regardless of income level.

Figure 3: Characteristics of Medicaid and Health Insurance Coverage in Selected Midwestern States
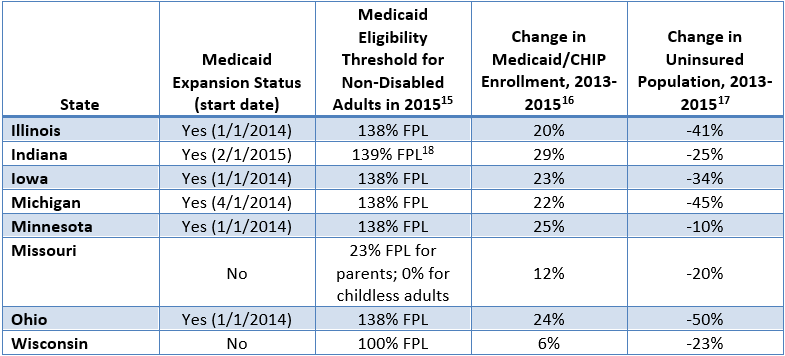
Figure 3: Characteristics of Medicaid and Health Insurance Coverage in Selected Midwestern States

(15)Kaiser Family Foundation, Medicaid Income Eligibility Limits for Other Non-Disabled Adults, 2011–2017, http://kff.org/data-collection/trends-in-medicaid-income-eligibility-limits/ (accessed 3/10/17) (16)Gates, R. Rudowitz, and S. Artiga, Two Year Trends in Medicaid and CHIP Enrollment Data: Findings from the CMS Performance Indicator Project (Menlo Park, CA: Henry J. Kaiser Family Foundation, June 2016): http://files.kff.org/attachment/Issue-Brief-Two-Year-Trends-in-Medicaid-and-CHIP-Enrollment-Data (accessed 3/10/17). (17)Kaiser Family Foundation. State Health Facts: Health Insurance Coverage of the Total Population, 2015: http://kff.org/other/state-indicator/total-population/ (accessed 3/10/17). (18)Indiana uses a state-specific income disregard that results in a slightly greater eligibility threshold for the group.


From 2011 to 2015, nearly all of the selected Midwestern states experienced a decrease in hospital uncompensated care costs (see Figure 4). Minnesota, with its early Medicaid expansion, saw uncompensated care decline immediately after 2011. States that expanded in 2014 experienced sharp declines from 2013 to 2014. Indiana, which expanded in early 2015, saw a drop in uncompensated care in 2015 after experiencing rising levels for three straight years from 2011 to 2014. Uncompensated care in Missouri, which did not expand Medicaid, is still above 2011 levels.

Overall, Michigan experienced the largest relative decrease in uncompensated care among the selected Midwestern states, dropping to 49 percent of 2011 levels in 2015. Wisconsin, which did not expand Medicaid but does not have a coverage gap, saw uncompensated care drop to 64 percent of 2011 levels. A study by the Wisconsin Hospital Association found similar declines in uncompensated care, especially from 2013 to 2015.(19)Wisconsin Hospital Association, Uncompensated Health Care Report,. Fiscal Year 2015 (Madison, WI: WHA Information Center, Sept. 2016): http://www.whainfocenter.com/uploads/PDFs/Publications/Uncompensated/Uncompensated_2015.pdf (accessed 3/10/17)

Figure 4: Uncompensated Care Costs Compared to 2011 Levels, by State
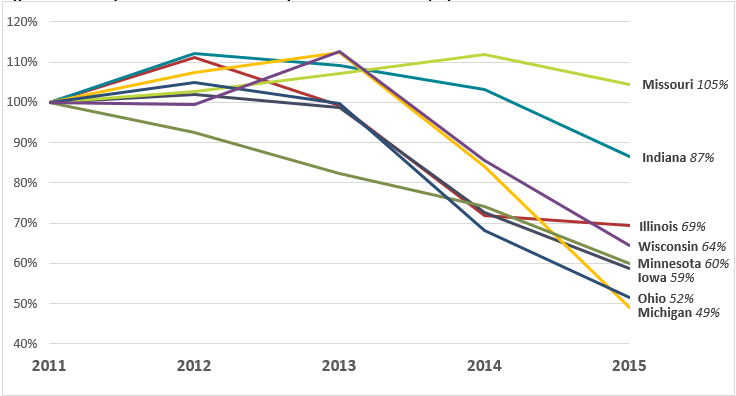
Figure 4: Uncompensated Care Costs Compared to 2011 Levels, by State


Conclusion

Medicaid expansion states have continued to experience large declines in hospital uncompensated care costs since 2014. As debate among state and federal policymakers about the future of the Affordable Care Act continues, it will be important to examine the connection between health insurance coverage expansions and financial outcomes for health care providers. Not all hospitals experienced the same effects of coverage expansion on uncompensated care, and it is not clear how hospitals would respond to policy changes that reduce the coverage gains under the ACA or the value of coverage to those who became newly insured.

Data and Methodology

We extracted hospital data on uncompensated care and other facility characteristics from publicly available cost reports submitted by hospitals to the Centers for Medicare and Medicaid Services (CMS) via the Healthcare Cost Report Information System (HCRIS). Data include reports collected by December 31, 2016, which were released on January 19, 2017. For this analysis, we restricted the set of hospitals to short-term acute and critical access hospitals that submitted complete reports for each year from 2011 through 2014. This eliminated rehabilitation, long-term, psychiatric, children’s, and other specialty hospitals that have high nonresponse rates or are not largely affected the ACA’s Medicaid expansion. The resulting data set includes 3,474 hospitals nationwide.

Hospitals submit worksheet S-10 as part of their cost report that breaks down their uncompensated care costs into their separate sources. In our analysis, we define uncompensated care as the sum of charity care (care delivered with no expectation of payment) and bad debt (care that is billed but no payment is received), but underpayments from public payers (Medicare, Medicaid, and the Children’s Health Insurance Program) were excluded. The use of cost report data for uncompensated care research is still relatively new, and not all responses from hospitals are audited by CMS. However, MedPAC has supported using worksheet S-10 to directly measure uncompensated care costs.(20)

Medicare Payment Advisory Commission. Report to the Congress: Medicare Payment Policy. March 2016.  http://www.medpac.gov/docs/default-source/reports/march-2016-report-to-the-congress-medicare-payment-policy.pdf services.pdf?sfvrsn=0 (accessed 6/6/17).
 Data for inpatient days and outpatient visits were extracted from worksheet S-3, part 1, and data on operating margins were extracted from worksheet G-3 of the cost reports.

Cost reports submitted to hospitals are based on individual hospitals’ fiscal years, which have varying beginning and end dates. To generate comparable time-series measures, we converted hospital fiscal year measures to calendar year estimates by combining the portion of each fiscal year that fell within a given calendar year. Uncompensated care amounts were converted from charges to costs using hospital-specific cost-to-charge ratios calculated in the cost reports, and all financial measures were adjusted for inflation to 2014 dollars. Facilities that reported outlier uncompensated care amounts compared to their historic trend were dropped from the study.

Hospitals were identified as for-profit, nonprofit, or government-owned based on control status data from the 2013 American Hospital Association annual survey.(21)American Hospital Association, Annual Survey Database: http://www.aha.org/research/rc/stat-studies/data-and-directories.shtml (accessed 3/17/16). Metropolitan status was determined based on the U.S. Department of Agriculture’s rural-urban continuum codes for 2013,(22)U.S. Department of Agriculture,Economic Research Service, Rural-Urban Continuum Codes: http://www.ers.usda.gov/data-products/rural-urban-continuum-codes.aspx (accessed 3/17/16). and hospitals were identified as teaching institutions if they indicated in their cost reports that they train residents as part of an approved graduate medical education program.

Appendix

Figure A-1: Uncompensated Care Trends in the United States, 2011–2015

Figure A-1: Uncompensated Care Trends in the United States, 2011–2015

Figure A-2: Uncompensated Care Trends by State, Medicaid Expansion States, 2011–2015
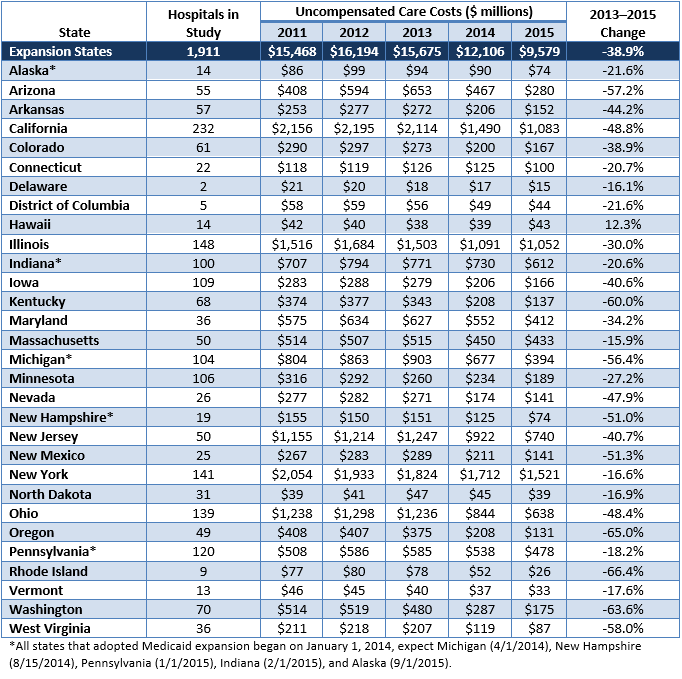
Figure A-2: Uncompensated Care Trends by State, Medicaid Expansion States, 2011–2015

Figure A-3: Uncompensated Care Trends by State, Non-Expansion States, 2011–2015
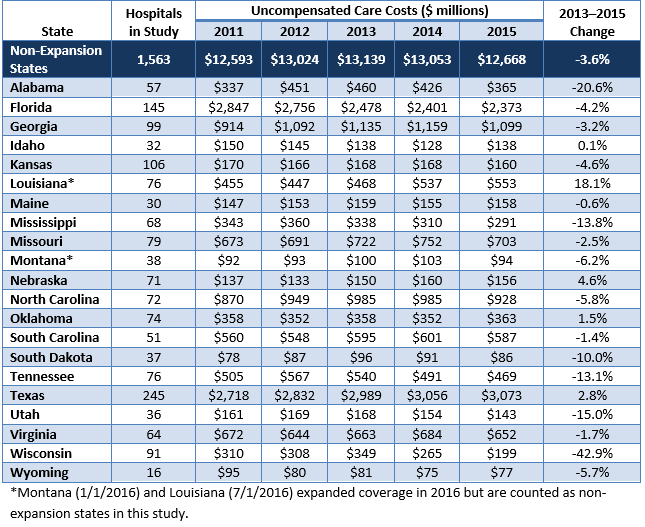
Figure A-3: Uncompensated Care Trends by State, Non-Expansion States, 2011–2015


References

References
1 Austic, E. Lawton, M. Slowey, M. Riba, and M. Udow-Phillips, Changes in Health Care Cost Barriers under the Affordable Care Act in Michigan (Ann Arbor, MI: Center for Healthcare Research and Transformation, March 2017).
2  Dussault, M. Pinkovskiy, and B. Zafar, “Is Health Insurance Good for Your Financial Health?” Liberty Street Economics, June 6, 2016: http://libertystreeteconomics.newyorkfed.org/2016/06/is-health-insurance-good-for-your-financial-health.html (accessed 3/10/17).
3 T. A. Coughlin et al.,  “An Estimated $84.9 Billion in Uncompensated Care Was Provided in 2013; ACA Payment Cuts Could Challenge Providers,” Health Affairs, May 2014, 33(5): 807–14: http://content.healthaffairs.org/content/33/5/807.full (accessed 3/10/17).(accessed 3/10/17).
4 Broader definitions of uncompensated care may include underpayments from Medicare and Medicaid, but underpayments were not included in this analysis.
5 Hospitals have different procedures and qualifications for how patients can apply for charity care assistance, which limits the comparison of charity care and bad debt measures across hospitals.
6 Fangmeier and M. Udow-Phillips, “Hospital Uncompensated Care, 2014,” Cover Michigan 2016 (Ann Arbor, MI: Center for Healthcare Research and Transformation, 2016).
7 A. Finkelstein, N. Hendren, and E.  Luttmer, “The Value of Medicaid: Interpreting Results from the Oregon Health Insurance Experiment,” NBER Working  Paper 21308 (Cambridge, MA: National Bureau of Economic Research, June 2015): http://www.nber.org/papers/w21308 (accessed 3/10/17).
8 C. Garthwaite, T. Gross, and M. Notowidigdo, “Hospitals as Insurers of Last Resort,” NBER Working Paper 21290 (Cambridge, MA: National Bureau of Economic Research, June 2015): http://www.nber.org/papers/w21290 (accessed 3/10/17).
9 F. Blavin, “Association Between the 2014 Medicaid Expansion and US Hospital Finances,” Journal of the American Medical Association, Oct. 11, 2016, 316(14): 1475–83.2016: http://jamanetwork.com/journals/jama/fullarticle/2565750 (accessed 3/10/17).
10 D. Dranove, C. Garthwaite, and C. Ody, “Uncompensated Care Decreased at Hospitals in Medicaid Expansion States But Not at Hospitals in Nonexpansion States,” Health Affairs, Aug. 2016, 35(8): 1471–9: http://content.healthaffairs.org/content/35/8/1471.abstract (accessed 3/10/17).
11 American Hospital Association, Uncompensated Hospital Care Cost Fact Sheet, December 2016:  http://www.aha.org/content/16/uncompensatedcarefactsheet.pdf (accessed 3/10/2017).
12 Ascension. Management’s Discussion and Analysis of Financial Condition and Results of Operations for Ascension, n.d.:  http://ascension.org/~/media/files/ascension/about/community-investor-relations/2017/management-discussion-q2-2017.pdf?la=en (accessed 3/10/2017).
13 Sommers, G. Kenney and A. Epstein, “New Evidence On The Affordable Care Act: Coverage Impacts Of Early Medicaid Expansions”, Health Affairs, Jan. 2014, 33(1):78–87: http://content.healthaffairs.org/content/33/1/78.full (accessed 3/10/17).

14 Adults with incomes below 100 percent FPL in all other non-expansion states fall into a coverage gap because they are ineligible for Medicaid coverage, and tax credits to purchase coverage on the health insurance marketplace are only available to those with incomes above 100 percent FPL.
15 Kaiser Family Foundation, Medicaid Income Eligibility Limits for Other Non-Disabled Adults, 2011–2017, http://kff.org/data-collection/trends-in-medicaid-income-eligibility-limits/ (accessed 3/10/17)
16 Gates, R. Rudowitz, and S. Artiga, Two Year Trends in Medicaid and CHIP Enrollment Data: Findings from the CMS Performance Indicator Project (Menlo Park, CA: Henry J. Kaiser Family Foundation, June 2016): http://files.kff.org/attachment/Issue-Brief-Two-Year-Trends-in-Medicaid-and-CHIP-Enrollment-Data (accessed 3/10/17).
17 Kaiser Family Foundation. State Health Facts: Health Insurance Coverage of the Total Population, 2015: http://kff.org/other/state-indicator/total-population/ (accessed 3/10/17).
18 Indiana uses a state-specific income disregard that results in a slightly greater eligibility threshold for the group.
19 Wisconsin Hospital Association, Uncompensated Health Care Report,. Fiscal Year 2015 (Madison, WI: WHA Information Center, Sept. 2016): http://www.whainfocenter.com/uploads/PDFs/Publications/Uncompensated/Uncompensated_2015.pdf (accessed 3/10/17)
20

Medicare Payment Advisory Commission. Report to the Congress: Medicare Payment Policy. March 2016.  http://www.medpac.gov/docs/default-source/reports/march-2016-report-to-the-congress-medicare-payment-policy.pdf services.pdf?sfvrsn=0 (accessed 6/6/17).

21 American Hospital Association, Annual Survey Database: http://www.aha.org/research/rc/stat-studies/data-and-directories.shtml (accessed 3/17/16).
22 U.S. Department of Agriculture,Economic Research Service, Rural-Urban Continuum Codes: http://www.ers.usda.gov/data-products/rural-urban-continuum-codes.aspx (accessed 3/17/16).

April 2017 HHS Rule and Other Proposals to Stabilize the Health Insurance Marketplaces

A screenshot of HealthCare.gov under a magnifying glass.Health plans are now determining whether to offer coverage in the Marketplace this fall and if so, which products and rates to offer. While there is continuing discussion about repealing and replacing the Affordable Care Act (ACA), legislative action does not appear imminent. To assure a robust ACA market, many have advocated for “repairs” to the ACA. These potential repairs to the ACA range from the addition of a “public option” in areas with low competition, to fixing the “family glitch,” to eliminating the Cadillac Tax.

In this fact sheet, we highlight some of the potential repairs to ACA that are currently in discussion and are particularly relevant to health plans as they decide whether or not to participate in the 2018 Marketplace.

The potential repairs we review are:

  • Fully fund cost-sharing reduction
  • Extend and fully fund the reinsurance program
  • extend and increase funding for risk corridors program
  • Require pre-enrollment verification by HHS to verify eligibility for special enrollment periods
  • Limit grace period for premium payments
  • Shorten open enrollment period
  • Allow increased variation in actuarial value requirements

The fact sheet also presents a timeline for insurer Qualified Health Plan (QHP) filings. On Feb. 17, 2017, the Centers for Medicare and Medicaid Services (CMS) announced plans to revise its schedule for the 2018 Qualified Health Plan (QHP) filing and rate review process for insurers offering coverage on the federally-facilitated Health Insurance Marketplaces created under the Affordable Care Act (ACA). This change is intended to give insurers more time to determine their participation and prepare their 2018 filings.

READ THE BRIEF

Michigander’s satisfaction with health care coverage has increased since ACA implementation

Two small blocks, one with a smiley face drawn in black and one with a frown face. A hand is moving the smiling block forward to show how health care satisfaction has increased since the implementation of the ACA.Data from the Center for Healthcare Research and Transformation’s (CHRT) Cover Michigan Survey describes the rate of satisfaction with health care coverage before and after implementation of the Patient Protection and Affordable Care Act (ACA).

Satisfaction with health care coverage in the state of Michigan has increased since the implementation of the ACA. In 2015, 57 percent of Michiganders reported that they were satisfied with their health coverage, which is in alignment with national rates of satisfaction with health care. This represents a significant increase from the 51 percent of respondents who reported they were satisfied with their health care coverage in 2012 before the ACA took effect. In 2014, 52% of Michigan residents reported that they were satisfied with their health care coverage.

The Cover Michigan Survey data presented in this brief were produced from a series of survey questions added to the Michigan State University Institute for Public Policy and Social Research quarterly State of the State Survey. Further methodology detail can be found on CHRT’s website. In 2015, the survey was fielded between October and December 2015 and included a sample of 972 Michigan adults, with a 17.0 percent response rate. In 2014, the survey was fielded between September and November 2014 and included a sample of 1,002 Michigan adults with a 20.2 percent response rate. In 2012, the survey was fielded between August and October 2012 and included a sample of 1,018 Michigan adults, with a 31.6 percent response rate.

READ THE BRIEF


Rate Analysis: Michigan’s 2017 Health Insurance Marketplace

health

Screenshot of HealthCare.gov, with information on the 2017 Health Insurance Marketplace.While the results of the 2016 presidential election have sparked recent debates about options to repeal and replace the Affordable Care Act, the health insurance marketplaces created under the law continue to operate as usual. So although the future of the law remains unknown, Michigan consumers who enroll in the 2017 Health Insurance Marketplace can likely expect their coverage to remain uninterrupted for the 2017 plan year.

The changing dynamics of the health insurance marketplace are important for 2017 enrollees to understand. Under current federal policy, enrollees who do not actively apply and enroll in 2017 coverage are auto-renewed into their 2016 plan, if it continues to be offered. Beginning with the 2017 open enrollment period, individuals who were enrolled in a plan offered by an issuer that is no longer participating in the marketplace will automatically be enrolled into a plan offered in their area by a different carrier if they do not actively choose another plan.

In addition, changes to benchmark plans directly affect premium tax credit amounts, so many enrollees will need to balance potentially higher costs for renewing their 2016 plan with other important considerations, such as the breadth of available provider networks.

READ THE BRIEF